Visium: the tutorial where Seurat is the one that's wrong
Dataset — 10x V1_Mouse_Brain_Sagittal_Anterior, Space Ranger 1.1.0 · 2,695 in-tissue spots (of 4,992 on the slide) × 32,285 genes
R side — Seurat 5.5.1 · tutorials/visium_verify.R
Python side — tutorials/visium_tutorial.py
What this compares, and why the method changed
The sixteen tutorials before this one shared a rule: Seurat is the reference, and a difference is truecell's defect until proved otherwise. That rule was right. It found 29 real defects and it never once cost anything.
Here it would have introduced one.
Seurat builds the Visium field of view like this:
fov <- CreateFOV(coordinates[, c("imagecol", "imagerow")],
                 type = "centroids", radius = scale.factors[["spot"]], ...)
and Read10X_ScaleFactors fills that field from spot_diameter_fullres. A
diameter goes into a slot named radius. Matching Seurat here means
being wrong by exactly 2×, so this tutorial reports the number instead of
asserting it — and proves which reading is correct without consulting either
tool.
Result
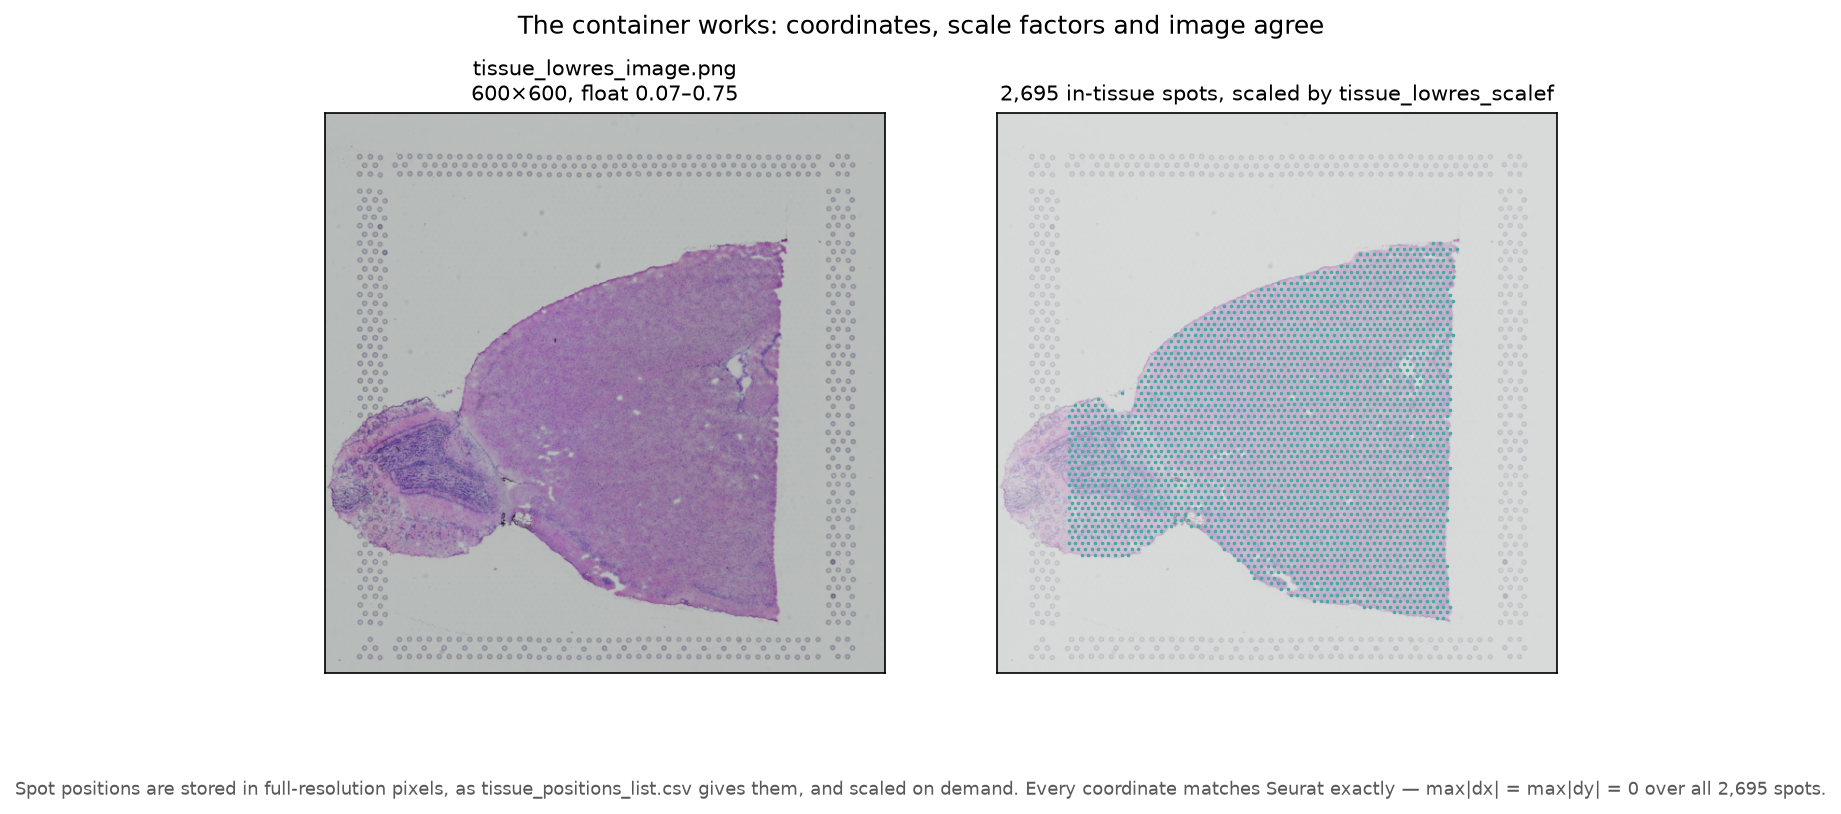
24 of 24 compared anchors match, 17 of them exactly. Coordinates agree to
max|dx| = max|dy| = 0 across all 2,695 spots, all four scale factors are
exact, and the tissue image matches to 1.68e-08 — float32 epsilon.
The R-side findings
1. spot_diameter_fullres is a diameter, and Seurat stores it as a radius
The Visium slide settles this. Capture spots sit on a fixed 100 µm centre-to-centre grid, so the measured spacing fixes the pixel scale, and the rest is arithmetic:
| measured spot spacing | 137.000 px |
| ⇒ scale | 1.3700 px/µm |
spot_diameter_fullres read as a diameter |
65.31 µm — 65 % of the pitch |
| read as a radius | 130.62 µm — overlaps its neighbour by 31 µm |
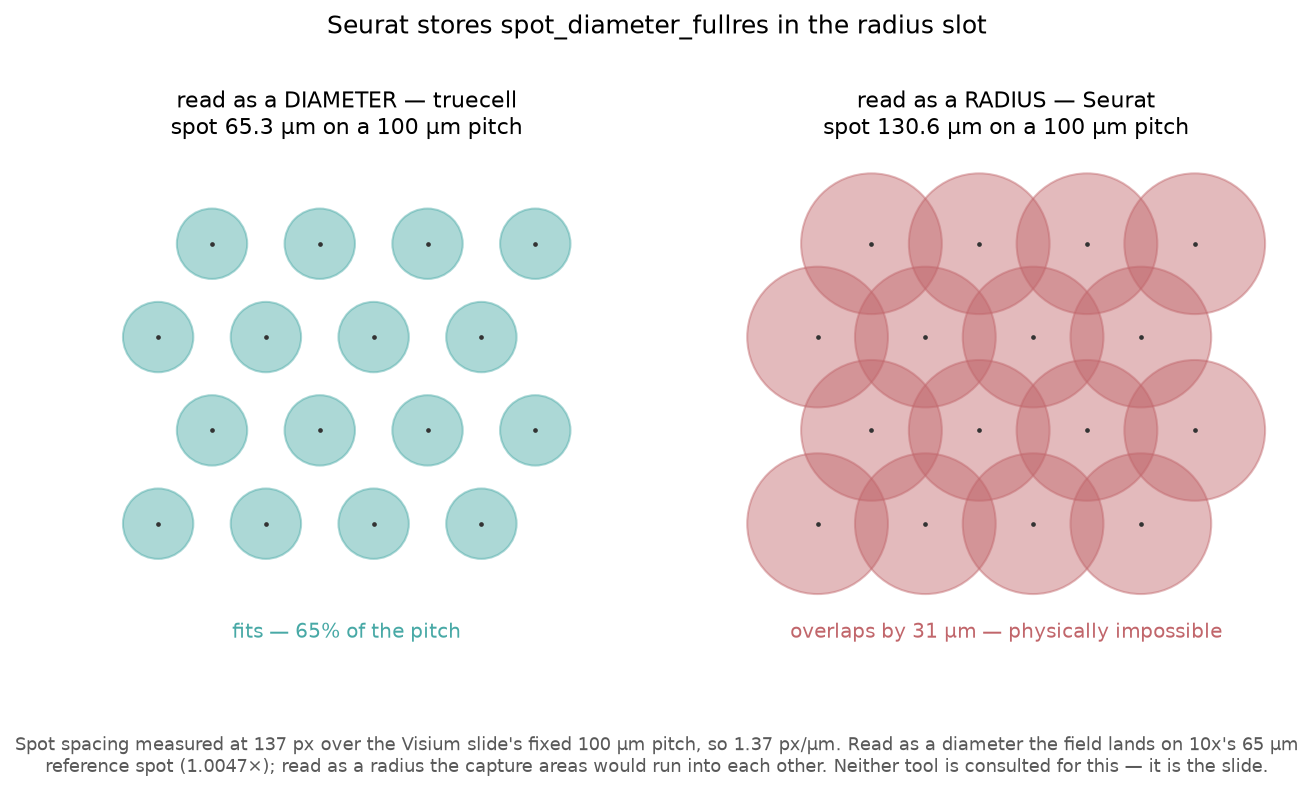
Capture spots are physically distinct wells. They cannot overlap. That argument needs no documentation and no reference implementation — and as a corroboration rather than a premise, read as a diameter the field lands on 10x's 65 µm reference spot to 1.0047×.
| radius | |
|---|---|
| Seurat 5.5.1 | 89.47199235723474 |
| truecell | 44.73599617861737 |
Ratio 2.000000. truecell keeps its value, and
test_truecell_radius_is_half_seurats_on_purpose pins the divergence so a later
"parity fix" cannot quietly introduce the bug.
2. Radius() returns NULL on a VisiumV2
methods("Radius") lists Centroids, STARmap, SlideSeq, SpatialImage and
VisiumV1 — there is no Radius.VisiumV2. The value is stored and reachable
one level down, but the accessor on Seurat 5's own current-generation Visium
class returns nothing. truecell's VisiumV2.radius() answers.
What the work found on truecell's side
The tissue image depended on which package you had installed
_imread tried matplotlib and fell back to Pillow. Those do not agree:
| backend | dtype | range |
|---|---|---|
| matplotlib | float32 | 0.0667 – 0.7490 |
| Pillow | uint8 | 17 – 191 |
R png::readPNG |
double | 0.0667 – 0.7490 |
255× apart, with different dtypes, from the same file — and neither
matplotlib nor Pillow is a declared dependency of truecell, so which branch ran
was environment luck. Plotting hid it completely, because imshow accepts both.
Normalised to float in [0, 1]. Both backends now return bit-identical arrays
that match Seurat to float32 epsilon. The guard that matters is not a dtype
assertion on one backend — that passes either way — but
test_both_image_backends_return_the_same_array, which reads the file twice and
compares, plus a third test confirming the Pillow branch is actually reached.
Three defaults that silently disagreed with Seurat
Breaking change, made deliberately:
| before | now | Seurat | |
|---|---|---|---|
| in-tissue filter | filter_by_tissue=False |
True |
filter.matrix = TRUE |
| image resolution | hires |
lowres |
tissue_lowres_image.png |
| image key | "spatial" |
"slice1" |
slice1 |
The last one is the one users hit: obj.images["slice1"] — what every ported
Seurat script writes — used to raise KeyError.
The filter default was invisible on this bundle, because
filtered_feature_bc_matrix already excludes off-tissue spots, so both tools
answered 2,695 for different reasons. Point truecell at raw_feature_bc_matrix
and they part, 4,992 against 2,695.
The old behaviour is still reachable:
GetTissueCoordinates now returns Seurat's frame
R returns x, y, cell and sets the rownames to the cells. truecell returned
x, y with cell on the index — the pandas idiom, no information lost, but not
the same frame, and coords$cell ported from R would fail on it. Both now.
The one real residual
variance.standardized differs, the two tools select 1995 of the same 2000
variable features, and the PCA that follows differs by 1.9e-3. That chain is
unchanged from the out-of-core tutorial: truecell's _loess2 is a NumPy
local-quadratic fit and R's loess is the cloess Fortran with kd-tree
interpolation.
The question worth answering is whether the PCA is also wrong. It is not:
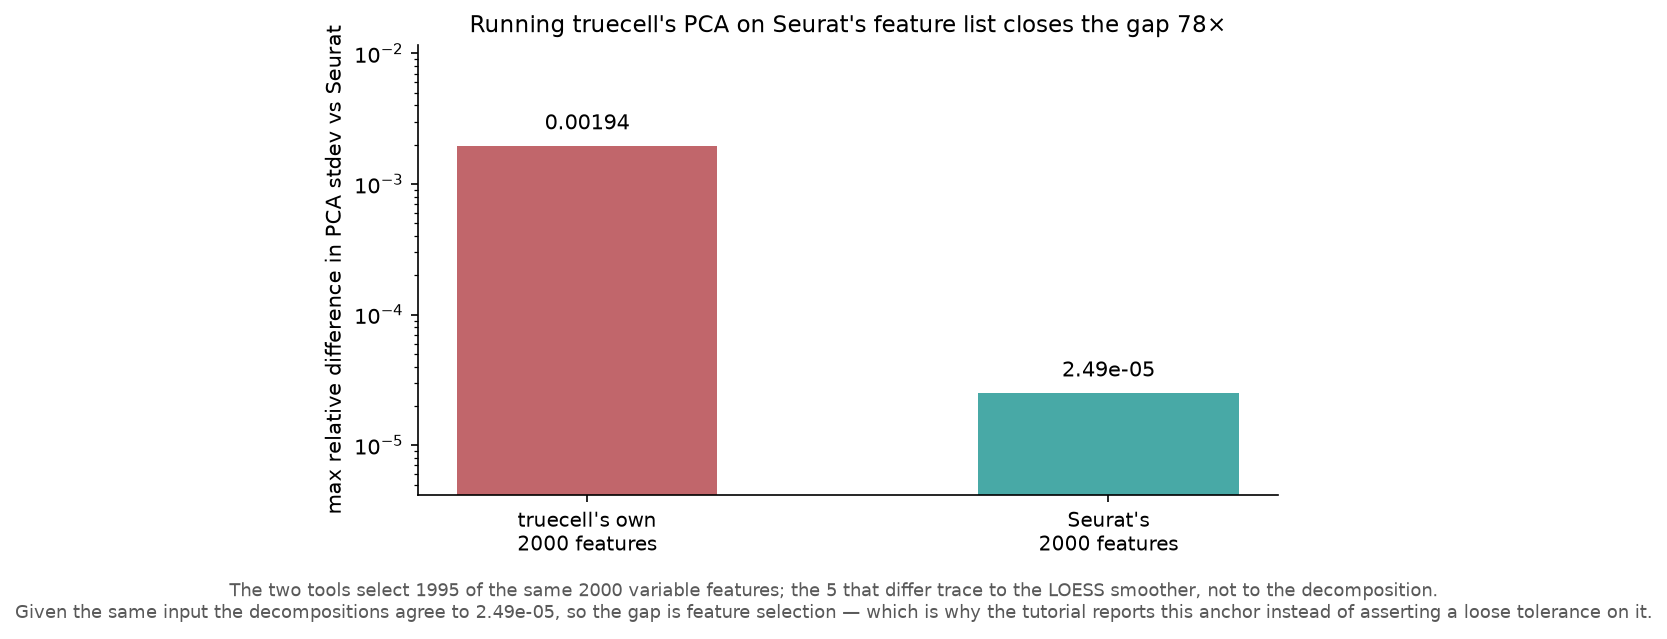
| PCA stdev, max relative difference vs Seurat | |
|---|---|
| on truecell's own 2000 features | 0.00194 |
| on Seurat's 2000 features | 2.49e-05 |
78× closer given the same input. The decomposition is fine; the gap is the
five features upstream of it. So pca.stdev_head is reported rather than
matched — asserting a loose tolerance on it would have hidden exactly this.
Reproducing
# Python side — downloads the bundle (~64 MB) and writes anchors
python tutorials/visium_tutorial.py

# R side
Rscript tutorials/visium_verify.R

# compare
python tutorials/visium_tutorial.py --report

# figures
python tutorials/generate_visium_plots.py
The dataset is fetched as the raw Space Ranger output, not through
SeuratData. A loader can only be tested against the files it is meant to read,
and the curated .rda carries a built object with no spatial/ directory. This
is Space Ranger 1.1.0, so positions arrive as the headerless
tissue_positions_list.csv — the older of the two layouts both
Read10X_Image and load_visium have to handle.
A note on measurement
visium_verify.R serialises with digits = 22, not digits = NA:
NA writes 15 significant digits, which does not round-trip a double. The 4.26e-14
gap that leaves is larger than several residuals under test. In the out-of-core
tutorial that floor produced three "findings" that were not real, and the fix
applied then — moving from round(x, 10) to digits = NA — was an improvement
rather than a cure. lazy_bpcells_verify.R still carries it; every tolerance
there sits well above 1e-14 so no conclusion changes, but it is worth correcting.
The first run of this comparison reported the scale factors as differing, for
precisely that reason. They are exact. The tutorial now compares against the
source scalefactors_json.json rather than against R's re-serialisation of it.