Mixscape — Separating true knockouts from escapers (R Seurat vs Truecell)
A side-by-side port of Seurat's Mixscape vignette.
In a pooled CRISPR screen (Perturb-seq / ECCITE-seq) every cell receives one
guide RNA against one gene, and the whole pool is sequenced together. The catch:
carrying a guide is not the same as being perturbed. A cell can pick up a
STAT1 guide and still escape the knockout — the edit fails, one allele survives
— so the cells labelled STAT1 are a mixture of true knockouts (KO) and
non-perturbed escapers (NP) that look just like controls. Averaging over that
mixture dilutes, and can entirely mask, the phenotype.
Mixscape (Papalexi, Mimitou et al. 2021) separates the two. Truecell ships all three of its steps, and this walkthrough runs them against their R references on the same GEO bytes:
calc_perturb_sig↔CalcPerturbSig— subtract from each cell the mean of its nearest non-targeting (NT) neighbours, leaving the local perturbation signature with technical variation cancelled out.run_mixscape↔RunMixscape— per target gene, an iterative two-component Gaussian mixture over the perturbation score splits KO from NP, so each guide gets a knockout rate instead of an assumption.mixscape_lda↔MixscapeLDA— one supervised map on which each guide population forms its own cloud.
Why this tutorial exists. Every Mixscape feature landed after PR #10 and had only ever been checked against synthetic fixtures with a known KO/NP truth. This is the first time the three functions meet real screen data with a Seurat reference. Mixscape is a stochastic, multi-stage pipeline (kNN, per-gene DE, an EM-refined mixture), so the target is not byte-identical calls but do the two tools recover the same biology — the same guides called strong-effect, KO/NP/NT proportions in step, per-cell class concordance.
The data — THP-1 ECCITE-seq, from raw GEO
truecell.datasets.thp1_eccite reads the original GEO matrices (GSE153056,
Papalexi et al. 2021) — the cDNA + protein counts and the published per-cell
metadata — not SeuratData's pre-built thp1.eccite object, whose internal
processing has no clean cross-language form. Both languages read identical counts.
The metadata already carries each cell's guide assignment, so both tools start
from the same annotated state.
The gene column is the label Mixscape works from: NT for the 2,386 controls,
or the targeted gene for the rest. Twenty-five genes were targeted — immune
checkpoints and the interferon-γ response pathway that regulates them.
Step 1 · Load, build the object, prep to PCA
Standard RNA prep (the reduction the signature needs), with one wrinkle that makes
the cross-tool comparison fair: both tools use the same variable-feature set.
The Python run writes the 2,000 HVGs it selected to figures_mixscape/hvg_features.txt,
and the R script reads them back — so the perturbation-signature basis is
byte-identical and the only divergences left are genuinely method-level (PCA
numerics, kNN ties, the DE test, the EM mixture).
Step 2 · CalcPerturbSig — the local perturbation signature
Guide assignment is confounded by everything else that varies between cells: cell
cycle, sequencing depth, replicate, ambient RNA. To strip that away, each cell has
subtracted from it the mean expression of its 20 nearest NT cells — found in
PCA space (first 40 PCs), within its own replicate so batch is never mistaken
for signal. What remains is the deviation from the controls the cell most
resembles, stored as a new PRTB assay.
| R (Seurat) | Python (Truecell) |
|---|---|
Step 3 · RunMixscape — knockout vs escaper, per guide
Working on the signature, each target gene is handled independently: its cells are tested for differential expression against NT (a gene with too few DE genes has no detectable phenotype, and all its cells are called NP); then an iterative two-component Gaussian mixture over the cells' projection onto the perturbation vector splits the high (KO) mode from the low (NP, anchored by the NT cells).
| R (Seurat) | Python (Truecell) |
|---|---|
| Global class | Truecell | R Seurat |
|---|---|---|
| KO | 4,942 | 5,107 |
| NP | 13,401 | 13,236 |
| NT | 2,386 | 2,386 |
The per-guide knockout rate is the headline: how often the edit actually took.
Both tools sort the same eleven guides into "has a detectable phenotype" and the
same fourteen to a flat zero — the checkpoint genes whose effect is at the
protein, not RNA, level (CD86, PDCD1LG2, CMTM6 …), which is exactly why the
original screen also measured protein.
| gene | Truecell KO rate | R KO rate | gene | Truecell | R | |
|---|---|---|---|---|---|---|
| STAT2 | 0.83 | 0.80 | IRF1 | 0.57 | 0.68 | |
| JAK2 | 0.78 | 0.78 | MYC | 0.57 | 0.23 | |
| SMAD4 | 0.75 | 0.82 | SPI1 | 0.52 | 0.44 | |
| STAT1 | 0.75 | 0.75 | CUL3 | 0.34 | 0.38 | |
| IFNGR2 | 0.74 | 0.74 | BRD4 | 0.31 | 0.45 | |
| IFNGR1 | 0.72 | 0.73 | (14 more) | 0.00 | 0.00 |
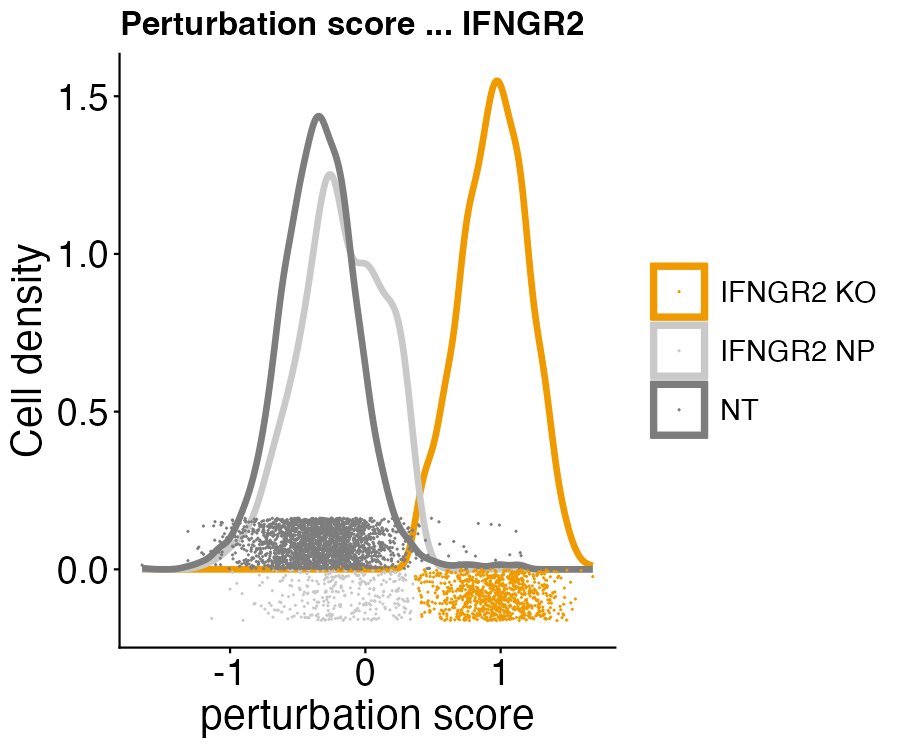
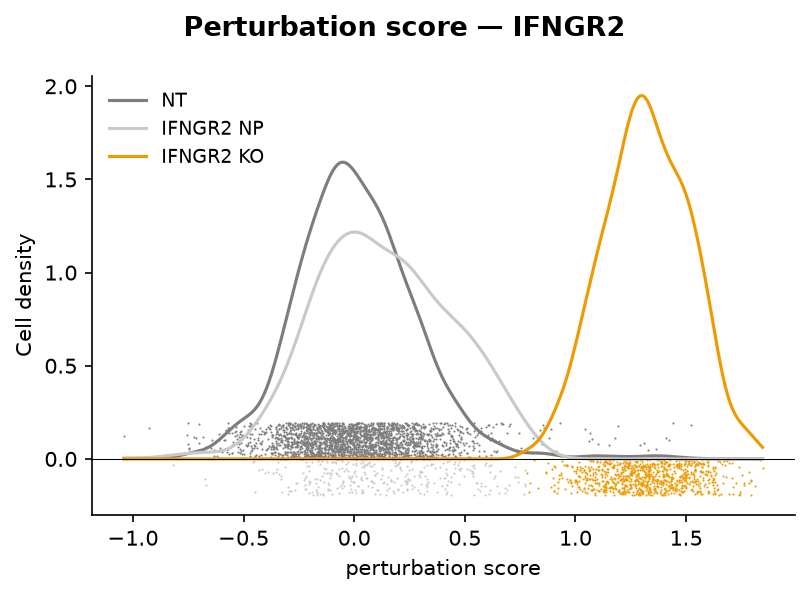
The perturbation-score density for IFNGR2 is the diagnostic for why
Mixscape split a guide the way it did: NT controls and the NP escapers share the
low mode, while genuine knockouts pull away into a high mode. The mixture model
finds exactly that structure.
R — PlotPerturbScore | Truecell — plot_perturb_score |
|---|---|
 |
 |
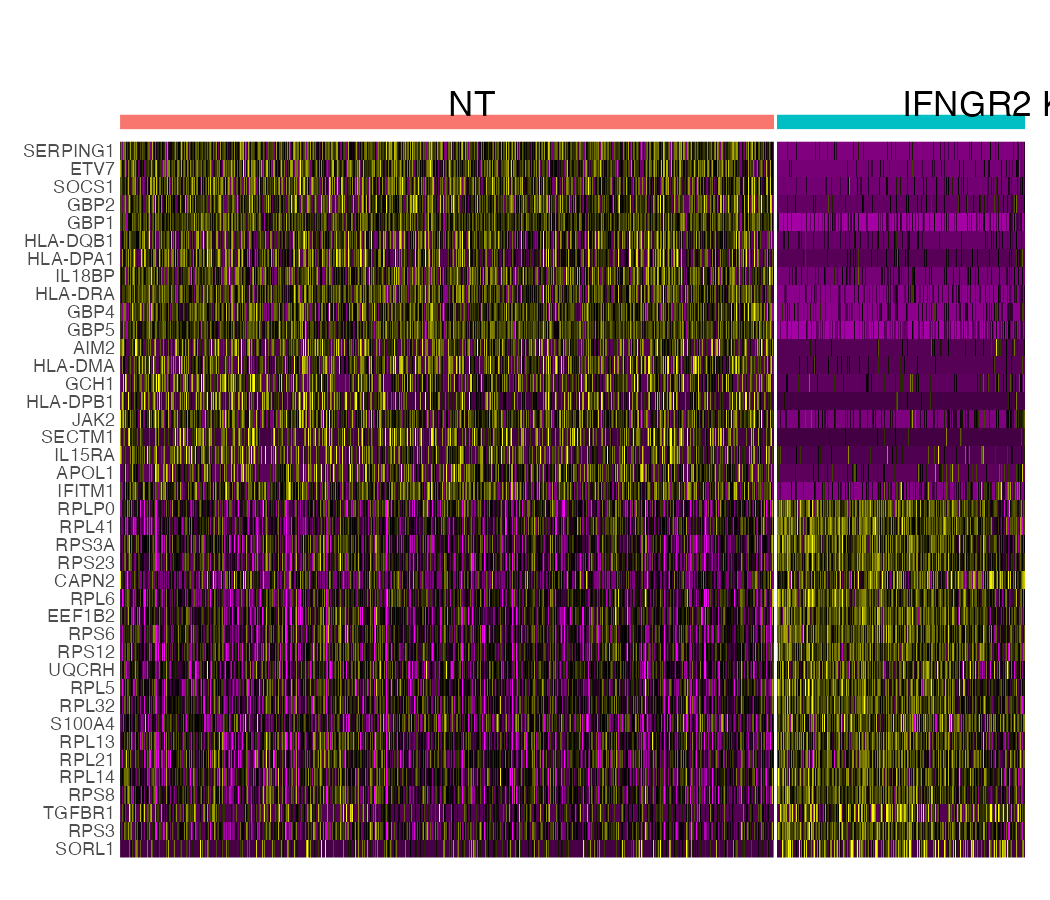
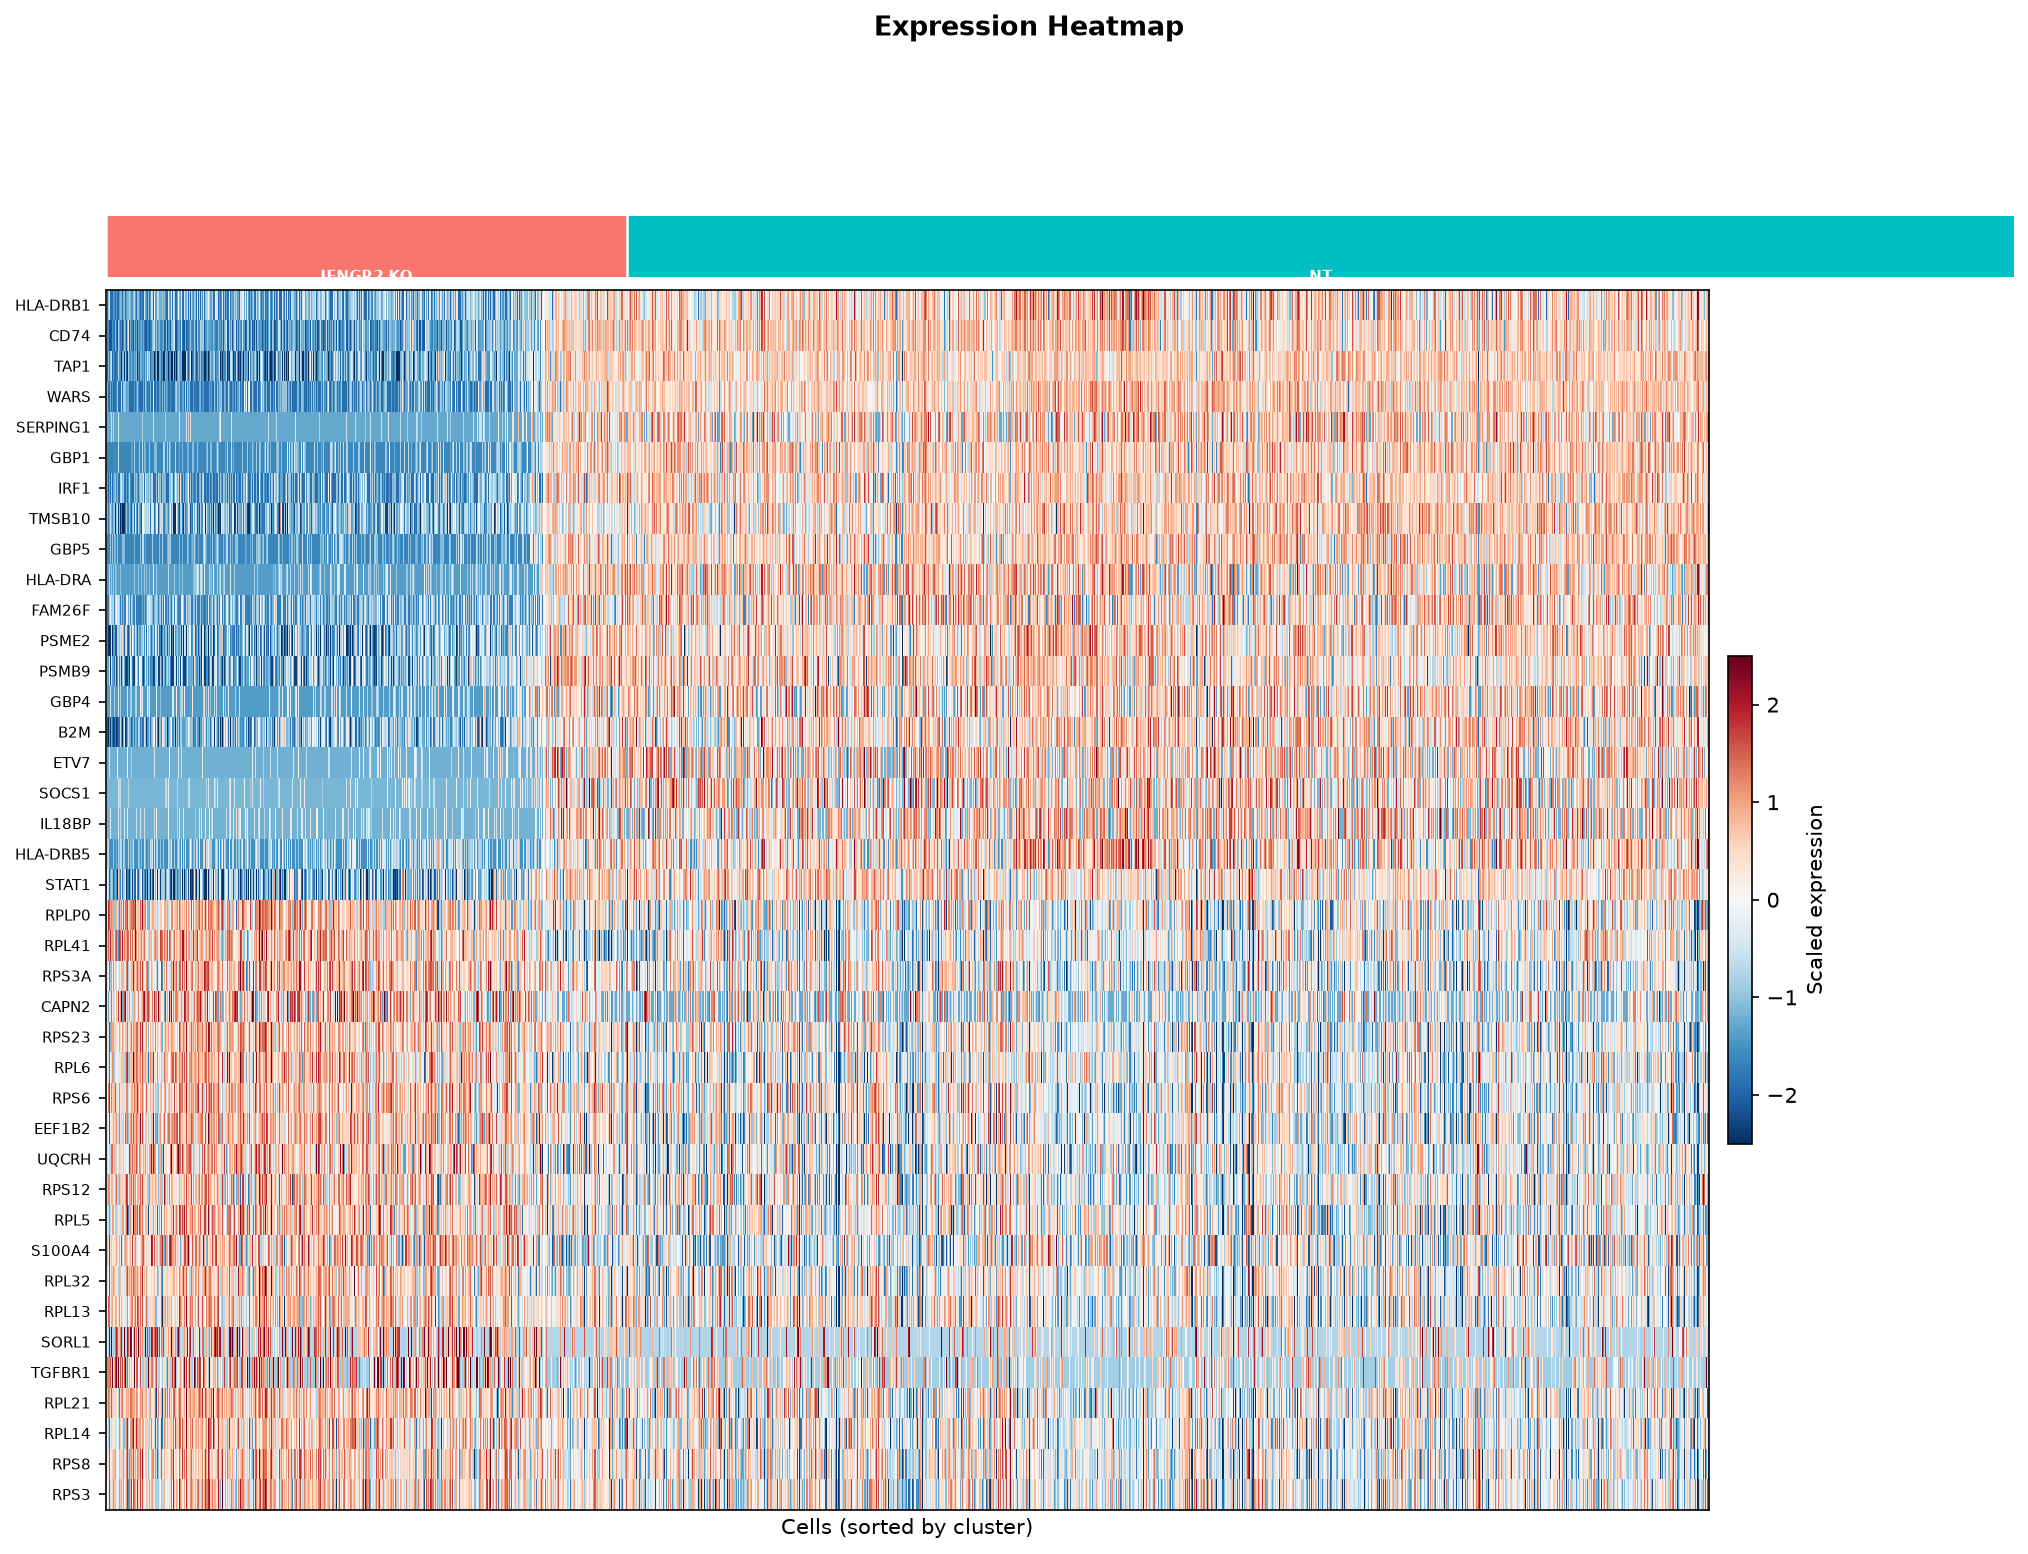
The genes underneath the score — DE between NT and IFNGR2 KO, every cell
ordered by its knockout probability — show the expression block turning on in step
with the posterior, the escapers at the low-probability end still looking like
control.
R — MixscapeHeatmap | Truecell — mixscape_heatmap |
|---|---|
 |
 |
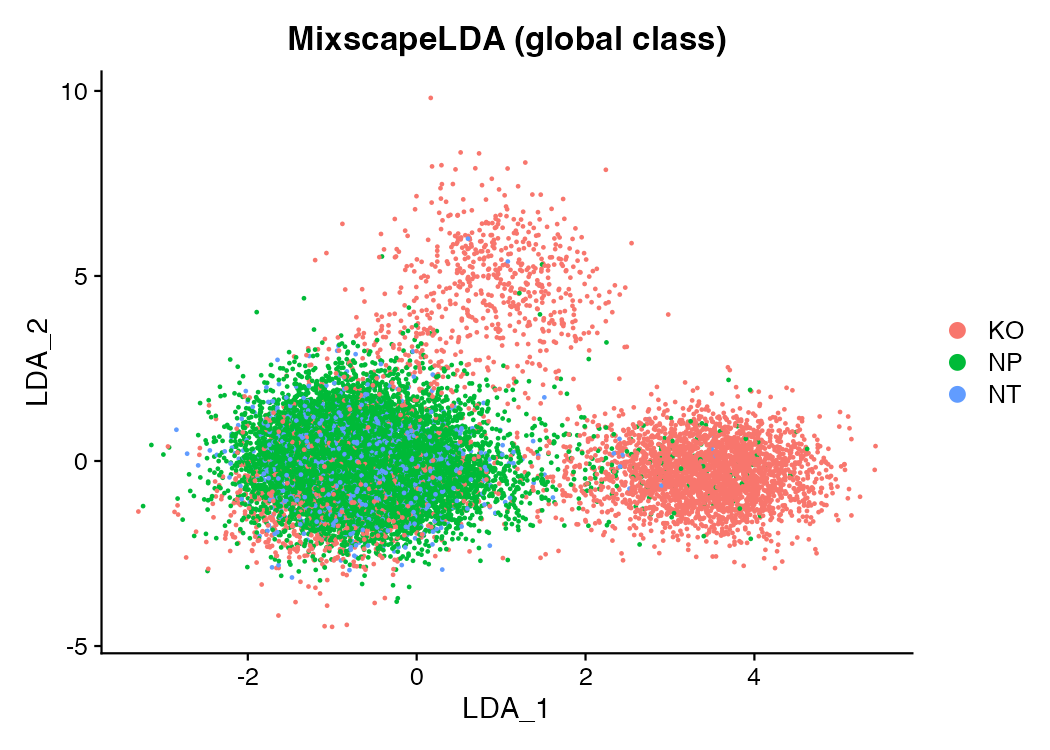
Step 4 · MixscapeLDA — separating the guide populations
Where run_mixscape asks which cells are perturbed, the LDA asks how do the
whole guide populations differ from each other and from control, and answers with
one supervised map. It reads only the perturbation signature and the raw guide
labels — the KO/NP calls are not used.
R — MixscapeLDA → DimPlot | Truecell — mixscape_lda → dim_plot |
|---|---|
 |
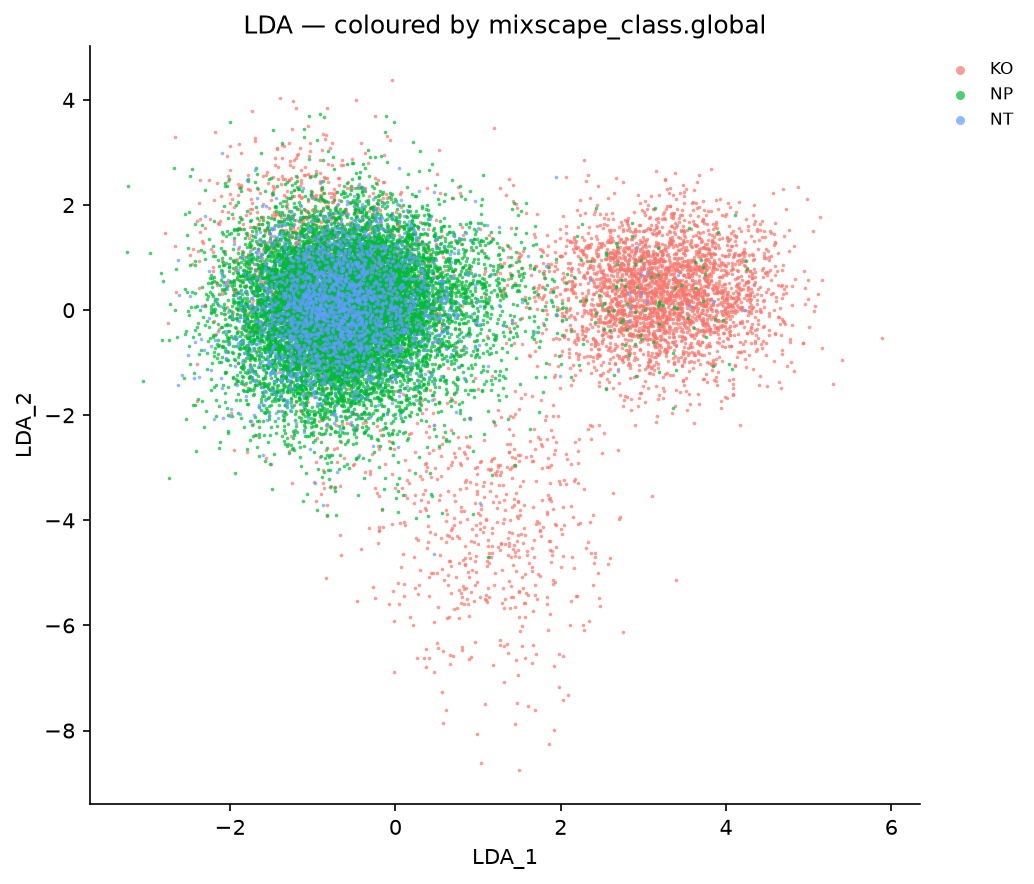 |
Read this map visually, not as a per-cell accuracy. Escaper (NP) cells resemble NT by design — that is the whole point of separating them — so they fall onto the NT cloud, and any "how often does the LDA label a guide cell with its own guide" score is meant to be low. What the map shows is the genuine knockouts of the strong guides pulling away into their own territory.
The headline · R-vs-Python concordance
Every cell, compared call-for-call against the Seurat reference on shared input and
a shared variable-feature basis (report_concordance() reads the r_calls.csv the
verify script writes):
| Comparison | Agreement |
|---|---|
| Mixscape global class (KO/NP/NT) | 97.68 % |
Mixscape full class (<gene> KO/NP) |
97.68 % |
Mixscape global — Truecell (rows) × R (cols):
| R KO | R NP | R NT | |
|---|---|---|---|
| KO | 4,832 | 204 | 0 |
| NP | 277 | 13,030 | 0 |
| NT | 0 | 0 | 2,386 |
Truecell reproduces Seurat to 97.68 % — 481 of 20,729 cells differ — with the
disagreement landing exactly where a mixture model is least certain. All 2,386 NT
cells agree; all 14 zero-phenotype guides agree 100 %; the strong interferon-γ
hits agree tightly (STAT1 98.4 %, JAK2 98.3 %, IFNGR2 97.8 %, IFNGR1
97.4 %). The divergence concentrates in the weak, boundary guides — MYC
(59 % of its cells differ), SPI1 (23 %), BRD4 (15 %), CUL3 (11 %) — whose
perturbation score sits close to the NT mode, so a small difference in the DE gene
set or the EM initialisation flips a cell KO↔NP. That is the genuinely
method-level residual, not a bug: scipy's GaussianMixture and R's mixtools
seed and iterate their EM differently, and the per-gene Wilcoxon DE breaks ties its
own way in each language.
These numbers are from after
run_mixscapebegan scaling each target gene's DE genes before the mixture, asRunMixscape's defaultslot = "scale.data"does. Unscaled, agreement was 97.46 % (527 cells differ). Eight of the eleven guides with an effect moved toward Seurat andSTAT1held;STAT2moved away by 0.2 points andMYC(109 cells) from 58 % to 41 %, the boundary case getting no easier.
No defect found — the Mixscape port recovers the same biology as Seurat, down to the same responsive-guide ranking and KO/NP/NT proportions. This is the confirmation the initiative was built to get, on a pipeline far more stochastic than the hashing demultiplexers.
Running it yourself
python tutorials/thp1_mixscape_tutorial.py    # downloads ~66 MB, writes HVGs, prints the report
Rscript tutorials/thp1_mixscape_verify.R      # Seurat reference → r_calls.csv + r_*.png
python tutorials/thp1_mixscape_tutorial.py    # re-run: now prints the R-vs-Python concordance
python tutorials/generate_mixscape_plots.py   # Truecell figures → figures_mixscape/py_*.png
The R reference needs the mixtools package (RunMixscape's mixture backend):
install.packages("mixtools").
Figures (tutorials/figures_mixscape/, r_* = R Seurat, py_* = Truecell):
| Figure | Description |
|---|---|
py_01_perturb_score.png |
IFNGR2 perturbation-score density — KO vs NP vs NT |
py_02_lda.png |
MixscapeLDA map, coloured by global class |
py_03_heatmap.png |
DE heatmap, NT vs IFNGR2 KO, cells by KO probability |
py_04_ko_rate.png |
Per-guide knockout rate — which edits actually took |
R Seurat → Truecell API
| Task | R (Seurat) | Python (Truecell) |
|---|---|---|
| Perturbation signature | CalcPerturbSig(obj, gd.class="gene", nt.cell.class="NT", ndims=40, num.neighbors=20, split.by="replicate") |
calc_perturb_sig(obj, labels="gene", nt_class="NT", ndims=40, num_neighbors=20, split_by="replicate") |
| Classify KO / NP | RunMixscape(obj, labels="gene", nt.class.name="NT", min.de.genes=5, prtb.type="KO") |
run_mixscape(obj, labels="gene", nt_class="NT", min_de_genes=5, prtb_type="KO") |
| LDA visualization | MixscapeLDA(obj, labels="gene", nt.label="NT", npcs=10) |
mixscape_lda(obj, labels="gene", nt_class="NT", npcs=10) |
| Global / full class | obj$mixscape_class.global / obj$mixscape_class |
obj.meta_data["mixscape_class.global"] / ["mixscape_class"] |
| Perturbation-score plot | PlotPerturbScore(obj, target.gene.ident="IFNGR2") |
plot_perturb_score(obj, "IFNGR2") |
| DE heatmap | MixscapeHeatmap(obj, ident.1="NT", ident.2="IFNGR2 KO") |
mixscape_heatmap(obj, ident_1="NT", ident_2="IFNGR2 KO") |
Reference
Papalexi E, Mimitou EP, Butler AW, et al. (2021) Characterizing the molecular regulation of inhibitory immune checkpoints with multimodal single-cell screens. Nature Genetics 53, 322-331. https://doi.org/10.1038/s41588-021-00778-2