Batch integration — Harmony, CCA & RPCA (R Seurat vs Truecell)
A side-by-side port of Seurat's integration vignette
on the Kang et al. 2018 PBMC dataset (ifnb): ~14,000 human blood cells, half
left resting (CTRL) and half stimulated for six hours with interferon-β
(STIM). Interferon drives a strong, near-global transcriptional response, so
without correction the cells split first by condition and only then by cell
type — the textbook batch effect.
The task integration solves: make the same cell type from the two conditions overlap, without erasing the biology that separates cell types. Truecell ships three integration paths, and this walkthrough runs all three against their Seurat references on identical counts:
run_harmony↔RunHarmony/HarmonyIntegration— iteratively nudges the PCA embedding so batches mix while clusters hold.integrate_layers(method="cca")↔FindIntegrationAnchors(reduction="cca")IntegrateData— anchors are mutual nearest neighbours in a shared canonical-correlation space.integrate_layers(method="rpca")↔RPCAIntegration— the reciprocal-PCA variant: each dataset is projected into the other's PCA space before the mutual-nearest-neighbour search.
Why this tutorial exists. Every integration function landed in v0.2.0 and had only ever been checked against synthetic fixtures with balanced batches. This is the first time they meet a real dataset with a Seurat reference and unequal batch sizes (CTRL 6,548 vs STIM 7,451). Integration embeddings are not expected to be coordinate-identical — harmonypy and R's harmony are separate implementations — so the target is do the two tools recover the same structure: the same collapse in batch separation, the same recovery of cell type, cluster partitions that agree. This tutorial is also the first in the initiative to find real defects — see the concordance section.
The data — ifnb, through the export bridge
ifnb is a curated SeuratData object with no clean raw source, so both languages
read the same counts, exported once from R by tutorials/export_seuratdata.R
into a 10x-style matrix folder. That guarantees byte-identical input and cell
order — the same discipline every other tutorial gets from a shared GEO download.
The stim column is the batch to remove; seurat_annotations is the cell-type
label to preserve — both ship with the dataset, so the two tools start from the
identical annotated state.
Step 1 · Load and prep to PCA — one shared variable-feature basis
Standard prep is the uncorrected starting point every method shares. One wrinkle
makes the cross-tool comparison fair, exactly as in the Mixscape tutorial: both
tools use the same variable features. The Python run writes the 2,000 HVGs it
selected to figures_integration/hvg_features.txt, and the R script reads them
back — so the only divergences left are the genuinely method-level ones (PCA
numerics, the integration algorithms, and R's approximate annoy neighbour
search).
Step 2 · Integrate — three ways
Harmony corrects the existing PCA in place; CCA and RPCA split the object by condition, anchor the two batches, and rebuild a corrected reduction. Each result is stored under its own name and clustered identically (Louvain, resolution 0.5, neighbours on 30 dims) so the comparison is like-for-like.
Step 3 · Score the integration
Two rotation-invariant summaries tell the story. Batch separation (silhouette
by stim, lower is better — a good integration mixes the conditions) and
cell-type preservation (silhouette by cell type, and the adjusted Rand index
of the clusters against the known annotations, higher is better). The Truecell
scoreboard:
| method | sil_batch ↓ | sil_celltype ↑ | n_clusters | ARI→celltype ↑ | batch-mix ↑ |
|---|---|---|---|---|---|
| uncorrected (PCA) | 0.1070 | 0.1413 | 16 | 0.5263 | 0.2314 |
| Harmony | 0.0077 | 0.1942 | 12 | 0.9217 | 0.9912 |
| CCA | 0.0039 | 0.2311 | 14 | 0.9280 | 0.9916 |
| RPCA | 0.0052 | 0.2195 | 15 | 0.7300 | 0.9165 |
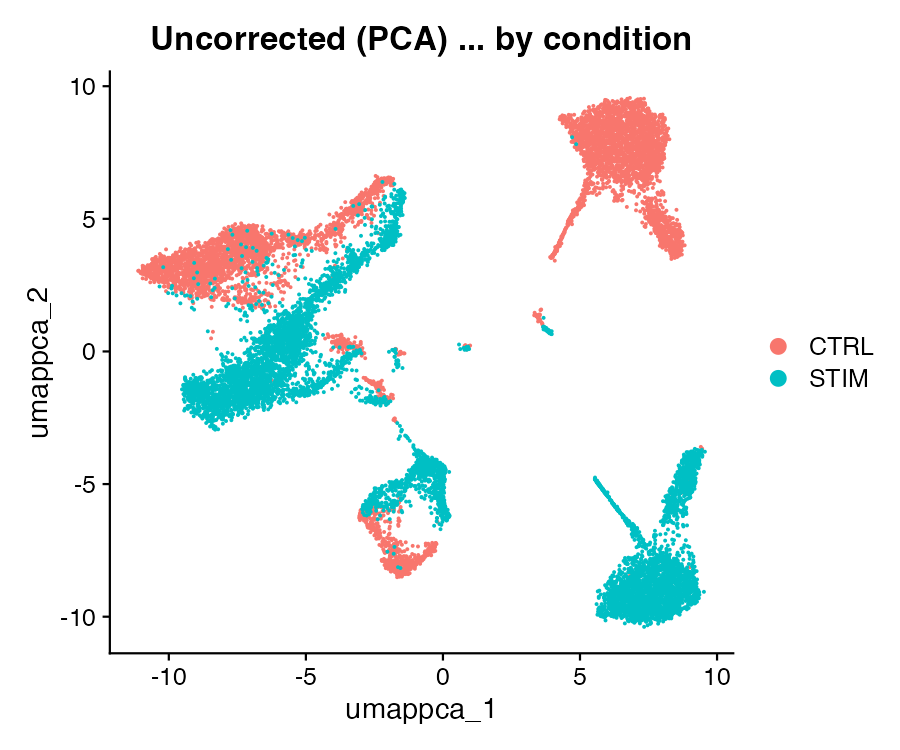
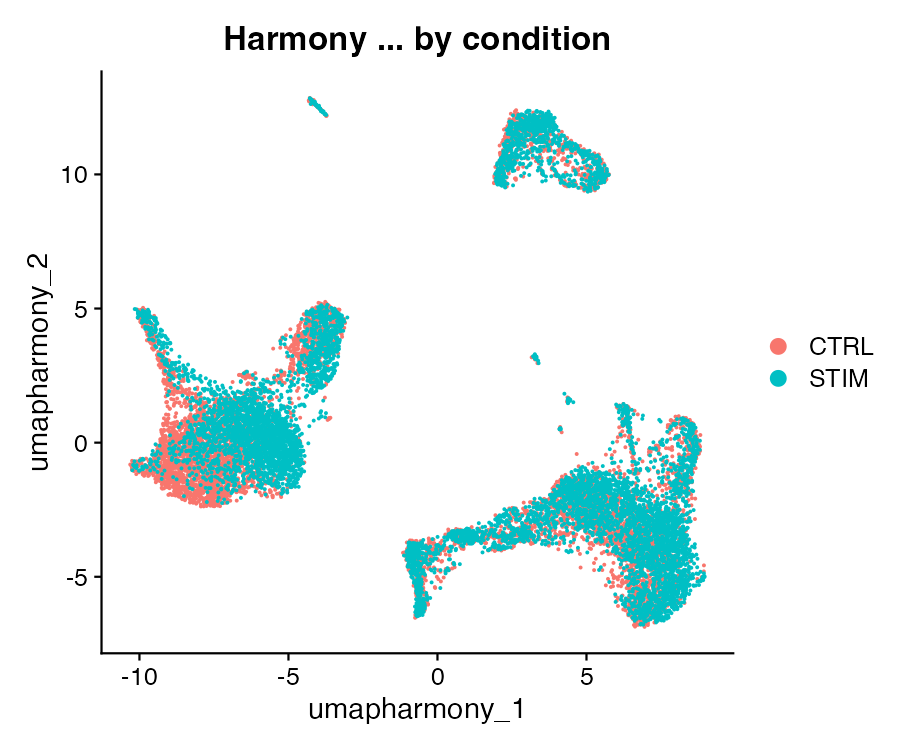
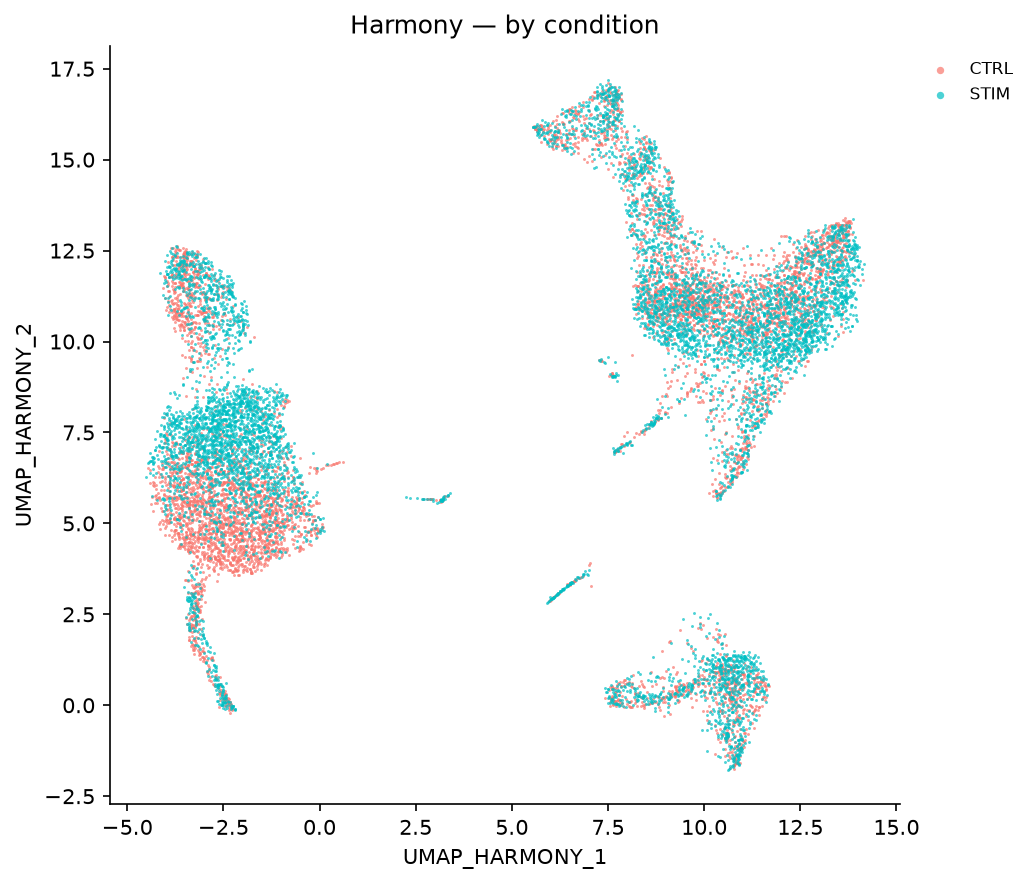
Uncorrected, the cells separate by condition (batch-mix 0.23 — clusters are mostly single-condition). All three methods remove that separation from the embedding (sil_batch 0.004–0.008). Harmony and CCA go on to mix the clusters fully and raise cell-type recovery to 0.92–0.93. RPCA's clusters mix less and recover cell types less, and so do Seurat's own on its RPCA embedding; the concordance section below shows why.
| R — uncorrected, by condition | Truecell — uncorrected, by condition |
|---|---|
 |
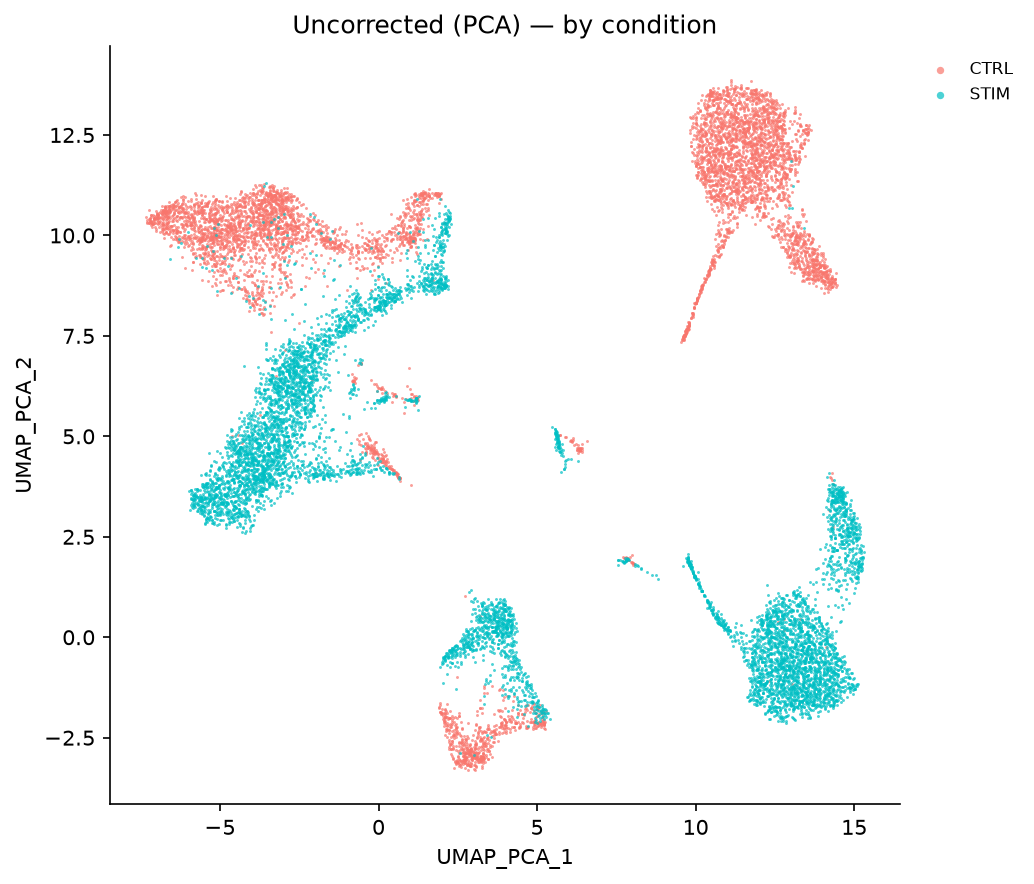 |
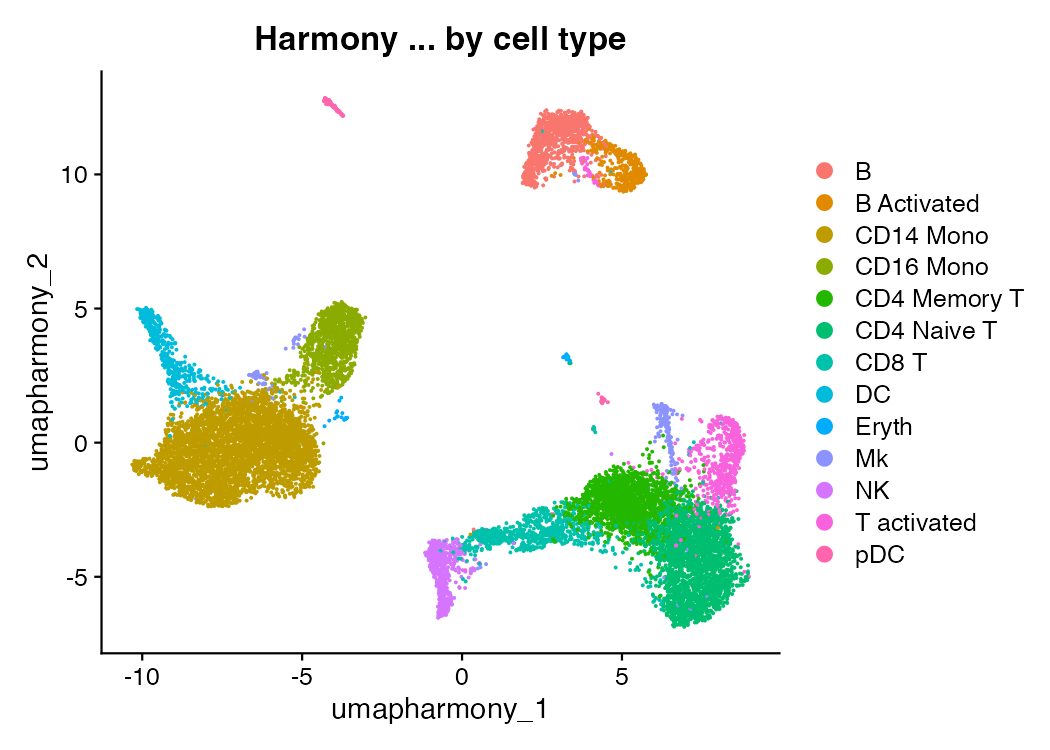
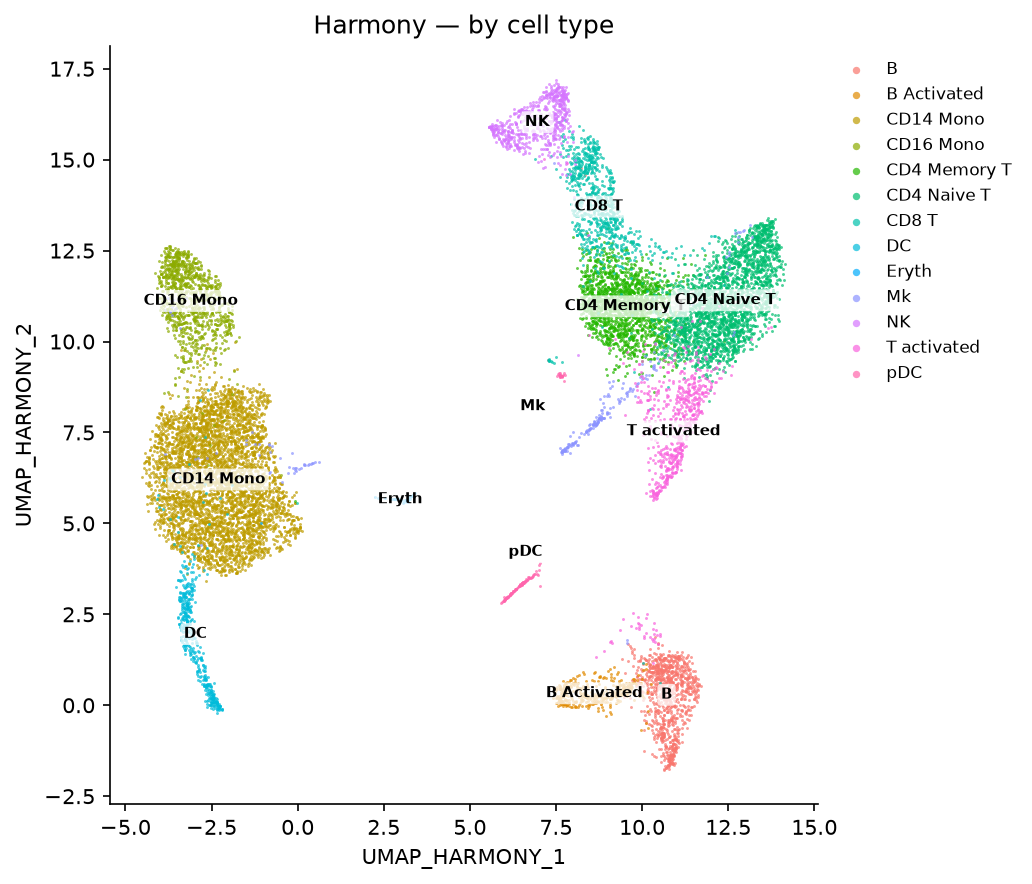
The two conditions form two clouds — the interferon shift dominates the embedding. After Harmony they interleave, while the cell types stay apart:
| R — Harmony, by condition | Truecell — Harmony, by condition |
|---|---|
 |
 |
| R — Harmony, by cell type | Truecell — Harmony, by cell type |
|---|---|
 |
 |
The headline · R-vs-Python concordance, and four RPCA bugs (all fixed)
Because integration embeddings are not coordinate-comparable across tools, the
concordance is partition-based: the adjusted Rand index between the two tools'
clusterings (ARI(py,R), 1 = identical), each tool's own cell-type recovery
(ARI→type — the biological check, the two columns should track), and each tool's
batch mixing (mix, 1 = fully mixed). All are computed from the cluster labels
report_concordance() reads out of the verify script's r_calls.csv.
| method | ARI(py,R) | py ARI→type | R ARI→type | py mix | R mix |
|---|---|---|---|---|---|
| PCA (baseline) | 0.9523 | 0.5263 | 0.5178 | 0.2314 | 0.1633 |
| Harmony | 0.9642 | 0.9217 | 0.9306 | 0.9912 | 0.9908 |
| CCA | 0.9828 | 0.9280 | 0.9273 | 0.9916 | 0.9909 |
| RPCA | 0.9424 | 0.7300 | 0.7364 | 0.9165 | 0.9171 |
All three integrations match Seurat closely on every axis, partition agreement included: truecell's integration paths reproduce Seurat's result on the standard benchmark, cluster for cluster. The uncorrected baseline, which neither tool is meant to get right, agrees at ARI 0.952.
RPCA took four bugs to get here, in two rounds. The first two were caught by an earlier pass of this tutorial and are described in the anchor-internals vignette: a crash on unequal batch sizes (#41), and an under-integration where truecell scaled batches globally instead of per-object and searched the raw reciprocal projection instead of Seurat's SD-standardized, L2-normalized one (#42). Those took RPCA's batch mixing from 0.222 to 0.867 and cell-type recovery from 0.444 (below the uncorrected baseline) to 0.677 — real fixes, but still short of Seurat's 0.914 / 0.735. At the time that residual read as "the expected implementation gap" — exact vs. approximate neighbours, scikit-learn vs. irlba PCA.
It wasn't a gap. It was two more bugs, found by T-int treating "the expected implementation gap" as a claim to verify rather than a place to stop:
integrate_layerswas running the wrong algorithm. Seurat v5'sIntegrateLayers(method = CCAIntegration/RPCAIntegration)does not callIntegrateData— it callsIntegrateEmbeddings, which corrects the PCA embedding itself by transposing it into a fake assay and running the same anchor machinery over it. truecell was running the v4 workflow instead (correct expression, re-scale, re-run PCA) — a different object with the same shape, which is why the two agreed on only 1 of 30 output dimensions above |r| = 0.99 on a matched-size probe.run_pcaused sklearn's randomized SVD. It switches solvers oncemax(shape) > 500, accurate in the leading components and drifting in the trailing ones — only 15 of 30 PCs matched Seurat's irlba above |r| = 0.99, with one PC down at 0.006. Harmless when only the leading PCs matter downstream, butIntegrateEmbeddingscorrects the embedding directly, so the drift landed straight in the output. Swapping in ARPACK (deterministic, 6× faster on this data, and exact enough to match irlba on all 30 PCs) fixed it without slowing the normal path.
Fixing both took embedding agreement from 1/30 to 30/30 PCs above |r| = 0.99
on the full 13,999-cell, unequal-batch dataset (STIM 7,451 is the reference,
Seurat's own PairwiseIntegrateReference rule), reference-half cells copied
through at exactly zero difference.
That left a clustering gap, now closed. With the embeddings in agreement,
ARI(py,R) for RPCA still stood at 0.774: truecell's clusters scored cell-type
recovery 0.922 and batch mixing 0.991, Seurat's 0.736 and 0.917. Clustering
Seurat's own RPCA embedding with truecell gave truecell's numbers, not
Seurat's, so the gap sat in find_clusters itself. Since find_clusters became
Seurat's own modularity optimiser, RPCA agrees at ARI 0.942, and both tools'
clusters score about 0.73 for cell types and 0.92 for batch mixing.
The clustering divergence, and why it was closed
The investigation ran Seurat's own RPCA embedding through both tools in three
stages — neighbours, graph, community detection — with nn.method = "rann" on
the R side so the neighbour search is exact on both.
Stages one and two agree. The k-nearest-neighbour indices are identical, cell for cell. Fed the same neighbour table, the two SNN graphs agree off-diagonal to 2.8e-08 — pure float32 rounding, since fixed. Whatever was happening, it was not the graph.
Stage three is where they parted, in how hard each searched. Seurat's
FindClusters runs its own modularity optimiser with n.start = 10 restarts and
keeps the best; truecell ran a single pass of igraph's multilevel Louvain. On
Seurat's graph, Seurat's partition scores 0.899903 and the single pass's
0.898336 under igraph's own modularity at γ = 0.5, and none of 20 seeds of
the single pass reaches Seurat's.
The deeper optimum does not look like the better answer. Seurat's 16 clusters split CD14 Mono in two, along the batch axis:
| Seurat cluster | cells | CD14 Mono | CTRL | STIM |
|---|---|---|---|---|
| 1 | 2,607 | 99.2% | 73.8% | 26.2% |
| 2 | 1,740 | 99.4% | 16.7% | 83.3% |
| dataset | 13,999 | 46.8% | 53.2% |
The extra 0.17% of modularity is bought by re-discovering the batch effect that
integration just removed. Against the dataset's seurat_annotations, the single
pass's 15 clusters score ARI 0.9195 to Seurat's 0.7368, and batch mixing
0.990 to 0.916, and 85% of 20 seeds of the single pass beat Seurat's
cell-type ARI.
In July that was the reason to leave truecell's search alone. The Frontiers
revision reversed the decision: a port is judged by whether it returns what
Seurat returns, and a user comparing the two tools should see the same clusters,
batch split included. find_clusters now runs a translation of Seurat's
optimiser, and on Seurat's own RPCA graph it returns Seurat's partition exactly,
all 13,999 cells. The single igraph pass remains available as
optimizer="igraph".
Neither search is stable across seeds on this graph. Over 10 seeds, Seurat's optimiser scores cell-type ARI 0.735–0.930; over 20, the single pass scores 0.72–0.93. If the answer matters more than the reproduction, cluster at a few seeds and compare.
Four graph defects found on the way
Establishing that the graphs agree meant comparing them to Seurat's element by
element, which turned up four things that were simply wrong. None changed
find_clusters output — it reads one triangle of the graph,
which silently discarded the very entries that were missing — but the graphs
are stored objects users read directly.
| was | Seurat | now | |
|---|---|---|---|
nn graph |
symmetrised | directed, nnz = n·k exactly |
directed |
snn diagonal |
dropped | SNN[i,i] = 1, all 13,999 |
kept |
snn precision |
float32 (~3e-08 off) | double | float64 (4.4e-16) |
| singletons | left alone | GroupSingletons absorbs them |
ported |
Symmetrising the KNN graph was the costliest: Seurat's nn is the raw ranked
table, so every row sums to k while column sums vary from 21 to 68 — that
spread is the in-degree, the signal that says which cells are hubs, and
mat + mat.T erased it. Both in-tree consumers already symmetrise at the point
of use, exactly as Seurat's own do.
Restoring the SNN diagonal also required following Seurat to the consumer:
RunUMAP.Graph opens with diag(x = object) <- 0, so run_umap now strips it
rather than feeding the layout n zero-length self-edges.
find_clusters gains group_singletons (default True), porting Seurat's
rule: a size-1 cluster joins whichever non-singleton cluster it is most
connected to, scored by mean SNN weight — a sum would just hand it to the
biggest cluster — with the candidate list fixed before the loop so one
singleton cannot absorb another. ifnb has no singletons at this resolution, so
none of this moved its numbers; it fires on smaller or sparser graphs.
Running it yourself
Rscript tutorials/export_seuratdata.R ifnb        # one-time counts export (~394 MB SeuratData pkg)
python  tutorials/ifnb_integration_tutorial.py    # writes HVGs, prints the scoreboard
Rscript tutorials/ifnb_integration_verify.R       # Seurat reference → r_calls.csv + r_*.png
python  tutorials/ifnb_integration_tutorial.py    # re-run: now prints the R-vs-Python concordance
python  tutorials/generate_integration_plots.py   # Truecell figures → figures_integration/py_*.png
The R reference needs the harmony package and enough headroom for Seurat v5's
parallel integration (options(future.globals.maxSize = 3 * 1024^3), set in the
script).
Figures (tutorials/figures_integration/, r_* = R Seurat, py_* = Truecell):
| Figure | Description |
|---|---|
py_01_uncorrected_stim.png |
UMAP of raw PCA, coloured by condition — the batch effect |
py_02_harmony_stim.png |
UMAP after Harmony, by condition — now mixed |
py_03_harmony_celltype.png |
Same map by cell type — the biology survived |
py_04_scoreboard.png |
Batch mixing vs cell-type recovery, per method |
R Seurat → Truecell API
| Task | R (Seurat) | Python (Truecell) |
|---|---|---|
| Harmony | RunHarmony(obj, "stim") / IntegrateLayers(method=HarmonyIntegration) |
run_harmony(obj, group_by="stim") / integrate_layers(method="harmony") |
| CCA anchors | FindIntegrationAnchors(list, reduction="cca") + IntegrateData / IntegrateLayers(method=CCAIntegration) |
find_integration_anchors(objs, reduction="cca") + integrate_data / integrate_layers(method="cca") |
| RPCA | IntegrateLayers(method=RPCAIntegration) |
integrate_layers(method="rpca") |
| Neighbours on a reduction | FindNeighbors(obj, reduction="harmony", dims=1:30) |
find_neighbors(obj, reduction="harmony", dims=range(30)) |
| Cluster | FindClusters(obj, resolution=0.5) |
find_clusters(obj, resolution=0.5) |
| UMAP on a reduction | RunUMAP(obj, reduction="harmony", dims=1:30) |
run_umap(obj, reduction="harmony", dims=range(30)) |
References
Kang HM, Subramaniam M, Targ S, et al. (2018) Multiplexed droplet single-cell RNA-sequencing using natural genetic variation. Nature Biotechnology 36, 89-94. https://doi.org/10.1038/nbt.4042
Korsunsky I, Millard N, Fan J, et al. (2019) Fast, sensitive and accurate integration of single-cell data with Harmony. Nature Methods 16, 1289-1296. https://doi.org/10.1038/s41592-019-0619-0