Leverage-Score Sketching — R Seurat vs Truecell (Python)
The Seurat v5 answer to "this atlas has two million cells and I have a laptop": don't subsample uniformly, subsample by statistical leverage, analyse the small subset, then push the answers back onto every cell. Every R Seurat call is paired with the Truecell equivalent and both outputs are shown side by side.
Dataset: ifnb — 13,999 human PBMCs, half stimulated with interferon-beta (Kang et al. 2018), the same object used in Tutorial 8. Exported once from SeuratData. R reference: Seurat 5.5.1 · Python: Truecell
| Seurat | Truecell |
|---|---|
LeverageScore(obj, features = hvg) |
leverage_score(obj, features=hvg) |
SketchData(obj, ncells = 2000, method = "LeverageScore") |
sketch_data(obj, ncells=2000, method="LeverageScore") |
SketchData(obj, ncells = 2000, method = "Uniform") |
sketch_data(obj, ncells=2000, method="Uniform") |
ProjectData(obj, refdata = list(...)) |
project_data(full, sketch, refdata={...}) |
This tutorial found and fixed two defects.
leverage_scorewhitened against the full rank instead of Seurat's rank-50 truncation, flattening the sampling weights until leverage sampling was uniform sampling.project_datatransferred labels through integration anchors, which is not what Seurat does and costs exactly what sketching exists to remove. Both are fixed in the same pull request; the findings are written up below with before-and-after numbers.
Headline
| Metric | Result |
|---|---|
| Leverage, exact regime — per-cell Spearman vs R | 1.000000 (max abs diff 4.0e-6) |
| Leverage, exact regime — top-200 / top-1000 cells shared | 100 % / 100 % |
| Leverage, sketched regime — Spearman vs R | 0.946 (differing RNGs) |
| Does leverage track rarity? Spearman(mean leverage, type size) | truecell −0.918 · R −0.918 |
| Rarest type (Eryth, n = 55) mean leverage vs overall | 2.80× |
project_data labels — per-cell agreement with R |
94.6 % (99.2 % on a shared sketch) |
project_data accuracy vs held-out annotations |
truecell 0.9074 · R 0.9029 |
| Lazy on-disk matrix — leverage vs in-memory | identical (9.4e-16) |
Setup
Both tools read the same exported counts, and the Python run writes the exact cell barcodes and variable features it used so the R script can subset to them. Leverage is a property of a matrix: if the two disagree about which cells or genes are in play, nothing below is interpretable.
| R (Seurat) | Python (Truecell) |
|---|---|
Pass features explicitly — this one bites
VariableFeatures(obj) <- hvg does not register for layer = "data".
LeverageScore looks up variable features for that layer, finds none, falls
back, and silently scores all 13,714 genes instead of the 2,000 you meant.
No error, no warning, a completely different matrix, and a divergence that looks
exactly like a port bug. It cost an hour of chasing a difference that was never
there.
# Wrong: scores all 13,714 genes, silently
VariableFeatures(ifnb) <- hvg
LeverageScore(ifnb, seed = 123L)

# Right
LeverageScore(ifnb, features = hvg, seed = 123L)
Leverage, and the two regimes
Seurat picks between two algorithms on cell count, and this tutorial exercises both on one dataset by moving the threshold rather than the data:
nsketch |
condition | algorithm | scores sum to |
|---|---|---|---|
| 10000 | 13999 < 1.5 × 10000 |
rank-50 truncated SVD | 50 |
| 5000 | 13999 ≥ 1.5 × 5000 |
CountSketch → QR → Johnson–Lindenstrauss | ~70,000 |
| R (Seurat) | Python (Truecell) |
|---|---|
The exact regime is a per-cell match:
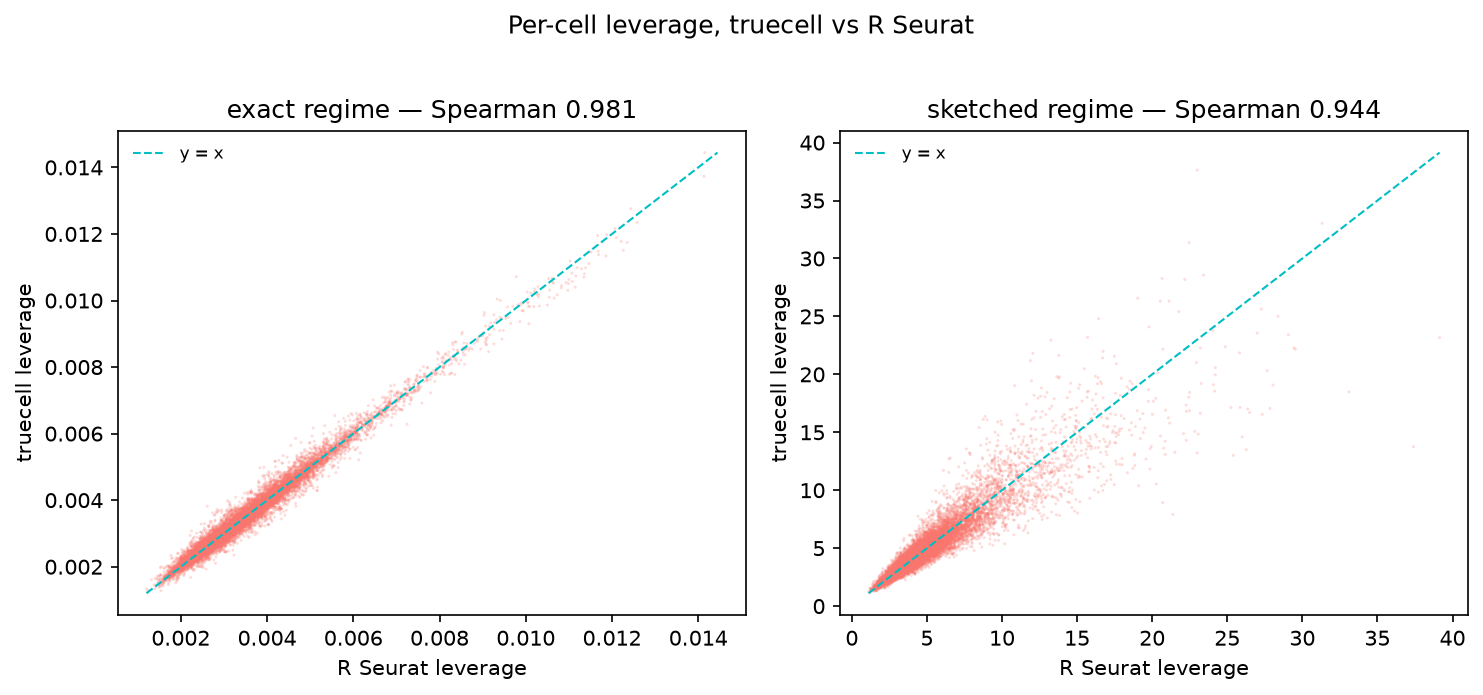
| regime | Spearman | Pearson | top-200 shared | max abs diff |
|---|---|---|---|---|
| exact | 1.000000 | 1.000000 | 100 % | 4.0e-6 |
| sketched | 0.946 | 0.924 | 58.0 % | 22.3 |
The exact panel is a clean diagonal — 4.0e-6 is below R's own run-to-run noise,
because irlba starts from a random vector and Seurat never seeds it (two R runs
with the same seed argument differ by 1.3e-4). The sketched panel scatters
symmetrically about the diagonal, which is what two different RNGs drawing the
same random matrices should look like; see the residuals.
Does leverage track rarity?
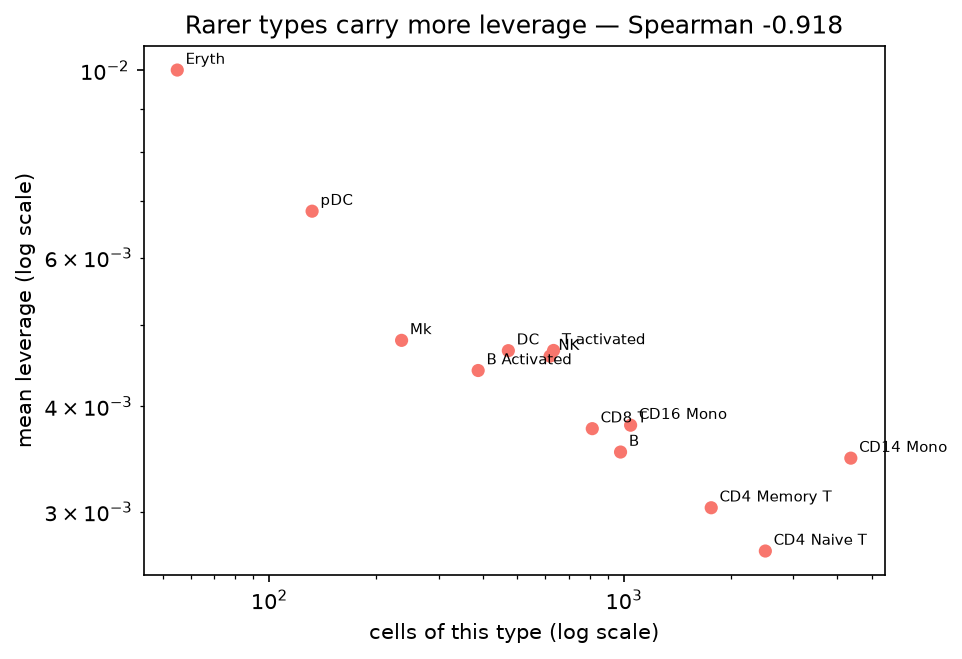
This is the question the method exists to answer, and the one no "do the numbers match" check would have caught. ifnb's annotations span 4,362 cells (CD14 Mono) down to 55 (Eryth), so it is directly measurable.
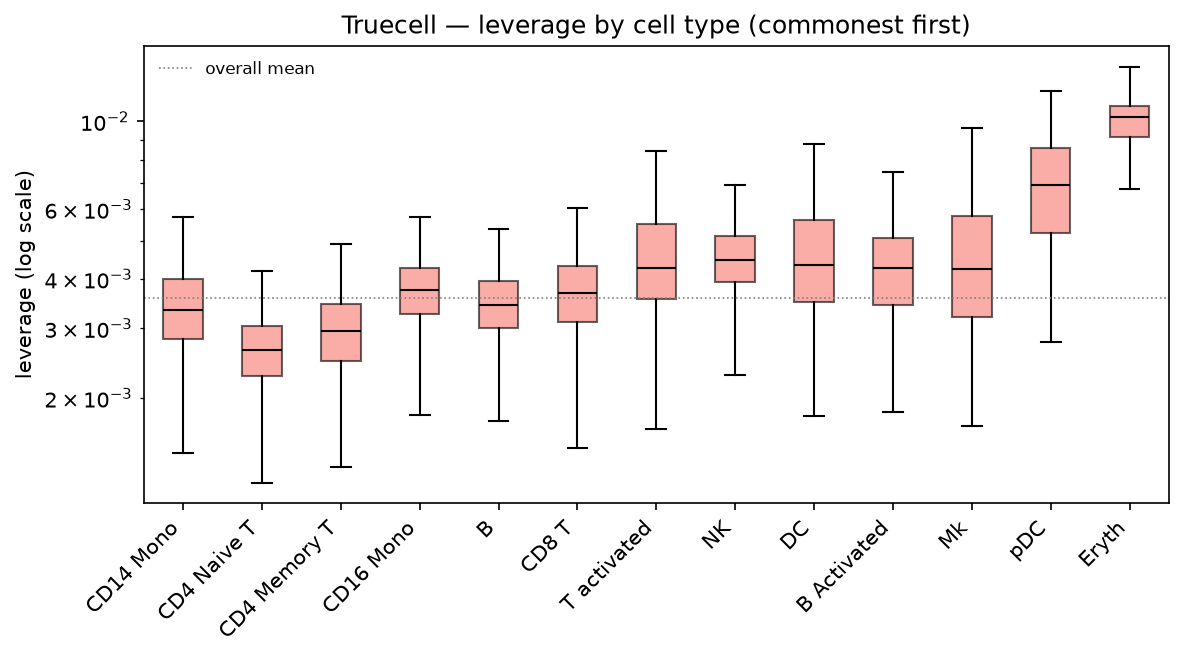
| cell type | n | mean leverage / overall |
|---|---|---|
| CD14 Mono | 4362 | 0.97× |
| CD4 Naive T | 2504 | 0.75× |
| CD4 Memory T | 1762 | 0.85× |
| CD16 Mono | 1044 | 1.06× |
| B | 978 | 0.99× |
| CD8 T | 814 | 1.05× |
| T activated | 633 | 1.30× |
| NK | 619 | 1.28× |
| DC | 472 | 1.30× |
| B Activated | 388 | 1.23× |
| Mk | 236 | 1.34× |
| pDC | 132 | 1.91× |
| Eryth | 55 | 2.80× |
Spearman(mean leverage, type size) = −0.918 in both tools. A near-monotone
inverse relationship with abundance — exactly the claim. It is also not a
sequencing-depth statistic in disguise: Spearman against nCount_RNA is +0.017.
What the sketch keeps
A 2,000-cell sketch (14 % of the data), against a same-size uniform draw. The control is not decoration: a 2,000-cell sample contains rare cells by accident, so "the sketch has rare cells" means nothing without it.
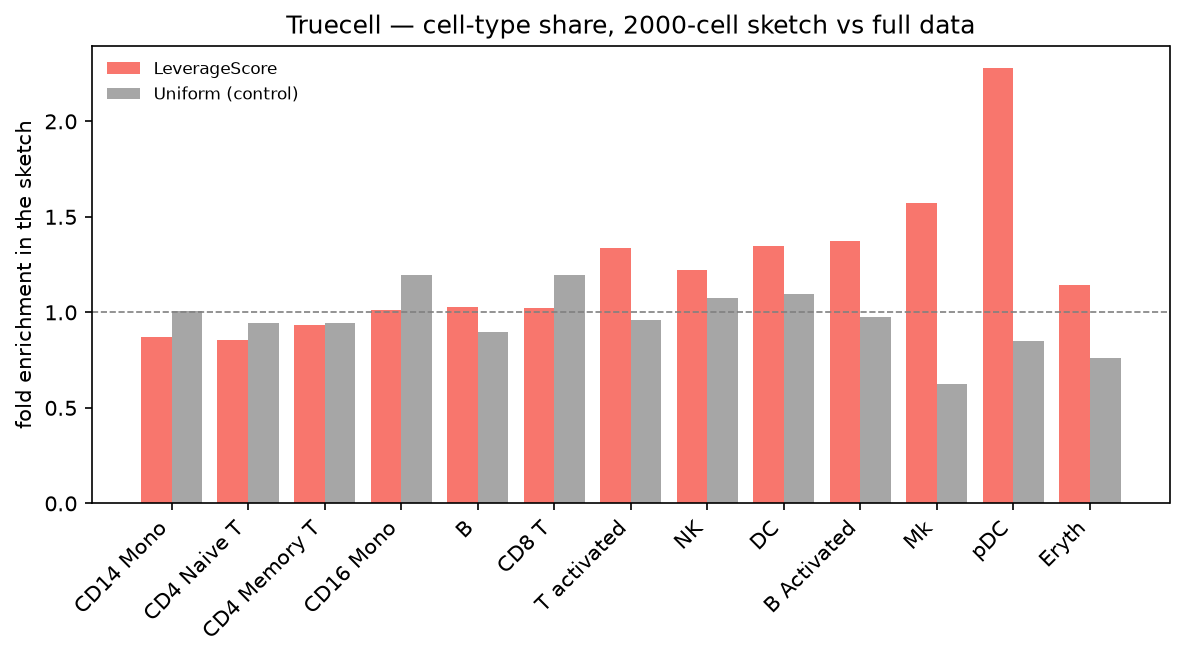
| cell type | n | leverage | uniform |
|---|---|---|---|
| CD14 Mono | 4362 | 0.87× | 1.01× |
| CD4 Naive T | 2504 | 0.86× | 0.94× |
| B Activated | 388 | 1.37× | 0.97× |
| Mk | 236 | 1.57× | 0.62× |
| pDC | 132 | 2.28× | 0.85× |
| Eryth | 55 | 1.15× | 0.76× |
The leverage bars climb with rarity; the uniform bars scatter around 1.0 without trend. That is the method working. Eryth's 1.15× is 9 cells in a single draw, a count on which one seed says little (see the residuals).
project_data — the sketch's analysis on every cell
Cluster and embed the 2,000-cell sketch, then extend both, plus its labels, to all 13,999 cells.
| R (Seurat) | Python (Truecell) |
|---|---|
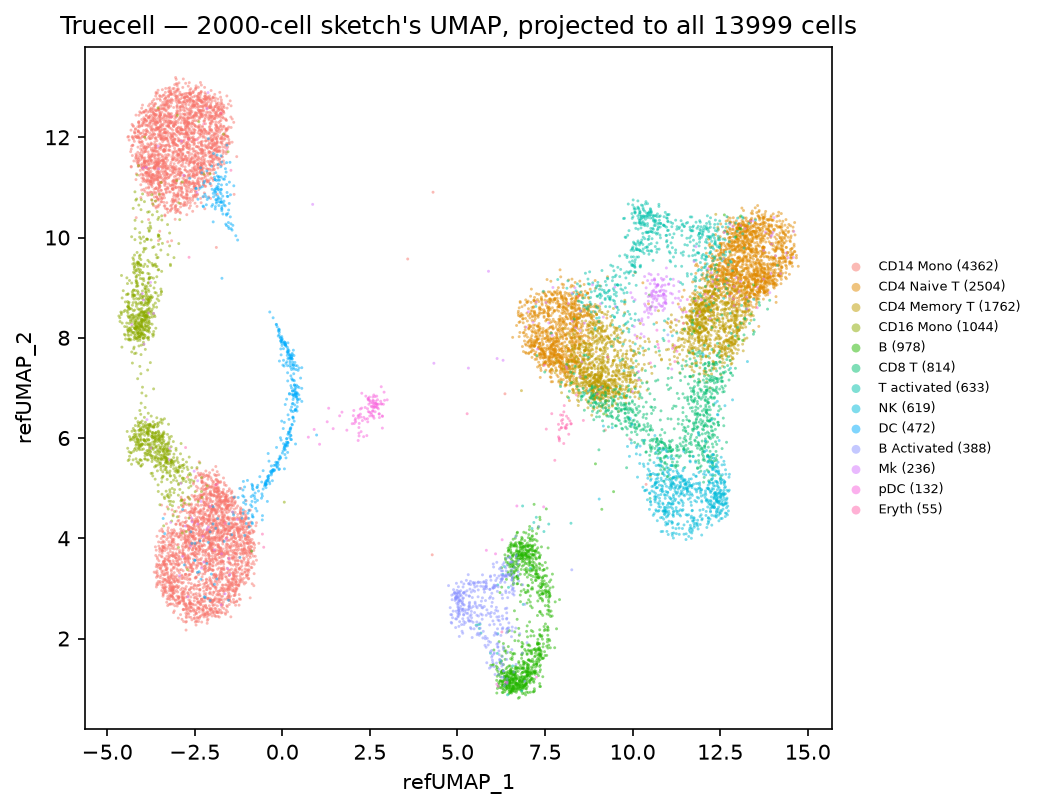
| truecell | R | |
|---|---|---|
| accuracy, all cells | 0.9074 | 0.9029 |
| accuracy, cells not in the sketch | 0.9035 | 0.8972 |
| per-cell agreement, each tool's own sketch | 94.6 % | 94.6 % |
| per-cell agreement, both on R's sketch cells | 99.2 % | 99.2 % |
Analysing 14 % of the cells and projecting recovers 90 % of the annotations on the 86 % never analysed.
Lazy matrices — no R counterpart
LazyMatrix / open_lazy_matrix are truecell's on-disk backing; R's equivalent is
BPCells, which is not installed here. So this is not a side-by-side — it
checks the one property that matters, reported separately so it is not mistaken
for an R comparison:
Going through disk does not change the answer.
What this tutorial found
1. Leverage was computed against the full rank
Seurat computes leverage from a rank-50 truncated SVD —
ℓ = rowSums(V²) over the leading 50 right singular vectors, so the scores sum
to 50. Truecell whitened against the full rank instead.
Both are defensible as "leverage": the full-rank version is the classical
hat-matrix definition, and truecell's own test asserted it to six decimals. But
full-rank leverage is useless on data shaped like this. Scores sum to the rank
and are capped at 1, so with 2,000 variable features over a few thousand cells
every score is crushed towards d/n:
| PBMC 3k, same 2000 HVGs | before | after | R |
|---|---|---|---|
| sum of scores | 2000.0 | 50.0 | 50.0 |
| coefficient of variation | 0.085 | 0.384 | 0.384 |
| max / median | 1.34 | 6.48 | 6.48 |
| Spearman vs R | 0.238 | 1.000 | — |
A max/median of 1.34 means the single most influential cell in the dataset was only 34 % more likely to be drawn than a median one — against 6.48× in Seurat, and 1.00 for uniform sampling. Sketching was an expensive way to sample uniformly, which is the exact thing leverage sampling exists to avoid. Nothing about the output looked wrong.
2. project_data transferred through the wrong machinery
ProjectData does not use integration anchors. It calls TransferSketchLabels,
a weighted k-nearest-neighbour vote inside the projected reduction, with the
sketch's own rows as the reference. Truecell ran the full
find_transfer_anchors → transfer_data path.
The wrong version scored better. On ifnb the anchor route reached 0.936 against Seurat's 0.905, which is why it survived review. It was still wrong, and not only on fidelity: finding anchors between the sketch and the full dataset costs precisely what sketching exists to remove, so on the million-cell objects this API is written for the anchor route is unusable rather than merely different.
| before | after | R | |
|---|---|---|---|
| accuracy (R's sketch cells) | 0.9321 | 0.9031 | 0.9050 |
| per-cell agreement (R's sketch cells) | — | 98.1 % | — |
| accuracy (own sketch, end to end) | 0.9363 | 0.9050 | 0.9050 |
These are the numbers from when the fix landed; the current ones are in the
project_data section above.
Matching Seurat made the headline number worse. A regression here would look like an improvement, so the test guarding it checks the mechanism — that no anchor object is built — rather than the score.
Seurat's weight kernel was recovered term-for-term from FindWeightsC:
distances (0, 0.25, 0.5, 1.0) give (0, 0.151737, 0.2942806, 0.5539824) in
both tools.
Why the old tests missed both
tests/test_sketch.py was green throughout. Its leverage test compared truecell
against truecell's own definition of exact leverage, and asserted
scores.sum() == rank — pinning the wrong answer to six decimals. Its sampling
test used a 200-cell, 80-feature fixture, which is outside the algorithm's
regime: keeping 50 of at most 80 components is barely a truncation. Exporting
that exact fixture to R settles it — R returns identical numbers (Spearman
1.000000) and shows no rare-cell enrichment either, and even warns
"You're computing too large a percentage of total singular values".
The new regression tests were mutation-tested: each was verified to fail against the restored old implementation.
The residuals
Three differences survive. All three were checked distribution-against- distribution over matched seeds, because single-pair comparisons were actively misleading here.
The sketched regime differs at Spearman 0.946. Over seeds 123/1/7/42/2024:
| truecell | R | |
|---|---|---|
| sum of scores | 69,611 – 70,968 | 70,278 – 70,867 |
| coefficient of variation | 0.5600 – 0.5770 | 0.5657 – 0.5776 |
The distributions overlap, so this is the two RNGs, not the algorithm.
Sketch composition. Over the same seeds:
| type | n | truecell | R |
|---|---|---|---|
| Eryth | 55 | 1.44× (1.15–1.91) | 1.29× (0.64–2.04) |
| pDC | 132 | 2.26× (1.91–2.49) | 2.23× (1.70–3.02) |
| Mk | 236 | 1.58× (1.33–1.87) | 1.47× (1.33–1.57) |
A single-seed comparison made Eryth look like a real divergence — 0.89× against 1.65×. It was two draws from overlapping distributions landing at opposite ends, and R's spread is the wider of the two. With ~11 erythrocytes in a 2,000-cell sketch, that is Poisson noise on a small count.
The two regimes against each other. Seurat's sketched approximation tracks its own exact scores at Spearman only 0.31. The JL projection is a large approximation and Seurat leaves it unscaled, so the sketched scores are not even on the same scale. Truecell reproduces that gap at 0.30 (R 0.308, truecell 0.304), which is the useful evidence that the sketched path is faithful. Compare scores within one regime, never across the two.
Reproducing this
Rscript tutorials/export_seuratdata.R ifnb      # one-time counts export
python  tutorials/ifnb_sketch_tutorial.py       # writes the shared lists
Rscript tutorials/ifnb_sketch_verify.R          # ~3 min
python  tutorials/generate_sketch_plots.py
The R script writes r_leverage.csv, r_sketch_composition.csv,
r_sketch_cells.csv and r_projection.csv into figures_sketch/; the Python
tutorial reads them back and prints the comparison. Without them the Python half
still runs and reports its own numbers.
Notes
- Compare within a regime. The exact regime's scores sum to 50; the sketched regime's sum to ~70,000 and are on the JL projection's own scale. They are not interchangeable, in either tool.
irlbais unseeded in Seurat. The exact regime is reproducible to ~1e-4 in R, not exactly. truecell uses a deterministic truncated SVD and lands inside that band.nsketchis bumped, not rejected. Below 1.1× the feature count Seurat raises it and warns; truecell does the same. Two hard stops are also ported: more than 5,000 features ("too slow") and a matrix with too few cells per feature ("too square").leverage_scorereads thedatalayer, notscale.data— matching Seurat. This changed in the same pull request.project_datano longer takesseed. The label vote is a deterministic weighted k-NN, so there is nothing left to seed.