Cell-cycle & module scoring (R Seurat vs Truecell)
A side-by-side port of Seurat's cell-cycle vignette
and AddModuleScore, run on the THP-1 ECCITE-seq dataset (GSE153056,
Papalexi et al. 2021). THP-1 is a proliferating monocytic-leukemia line, so —
unlike the resting PBMCs of the earlier tutorials — it carries substantial S and
G2/M populations, which is what makes cell-cycle scoring a meaningful test
rather than "everything is G1". (We reuse the Mixscape tutorial's
counts; the perturbation labels are irrelevant here — only the raw RNA matters.)
The task these two functions solve: score a gene program per cell against a matched control set, so the score reflects the program and not a cell's overall depth or its genes' baseline abundance.
add_module_score↔AddModuleScore— the general primitive: a program's score is its genes' mean expression minus the mean of control genes drawn from the same average-expression bins, so highly- and lowly-expressed programs are put on the same footing.cell_cycle_scoring↔CellCycleScoring— module scoring applied to the Tirosh 2016 S and G2/M gene sets (Seurat'scc.genes.updated.2019), then a discretePhaseper cell:G1when both scores are ≤ 0, else whichever of S / G2M is larger.
Why this tutorial exists.
add_module_score/cell_cycle_scoringlanded with only synthetic fixtures. This is the first time they meet a real dataset with a Seurat reference. The wrinkle worth stating up front: both functions sample control genes at random (binned by expression), and NumPy's RNG is not R's — so on identical counts and identical gene lists the per-cell scores are not byte-identical. They do correlate almost perfectly (the algorithm is the same; only the control draw differs), and the discretePhase— a thresholding of those scores — is robust to the small score wobble. So the comparison targets are per-cell Phase concordance and score correlation, the same "faithful port, RNG-driven residual" story asclara(hashing) and the KDE step (MULTI-seq).
The data — THP-1, a proliferating line
Both tools read the same GEO counts the Mixscape tutorial caches. THP-1 divides actively in culture, so a real minority of cells sit in S and G2/M:
To rule out gene-list drift as a second source of divergence, the Python run
writes the exact S / G2M / interferon gene symbols it resolved against the assay
to figures_cellcycle/*.txt, and the R script reads them back — so the only
thing left to differ is the control-gene RNG. The dataset also ships Papalexi's
own published Phase (from their Seurat run); we keep it for a bonus external
sanity check, but the controlled comparison is truecell vs a fresh R
CellCycleScoring on identical input.
Step 1 · Load and normalize
Cell-cycle and module scoring run on the log-normalized data layer — no
variable features, scaling or PCA required.
Step 2 · Score the cell cycle and a module
CellCycleScoring writes S.Score / G2M.Score / Phase; AddModuleScore
scores any program — here a compact interferon-response signature, apt for a
dataset whose screen targets interferon-γ regulators. Both tools score the
same resolved gene lists (written by the Python run).
| R (Seurat) | Python (Truecell) |
|---|---|
Step 3 · Read the scores
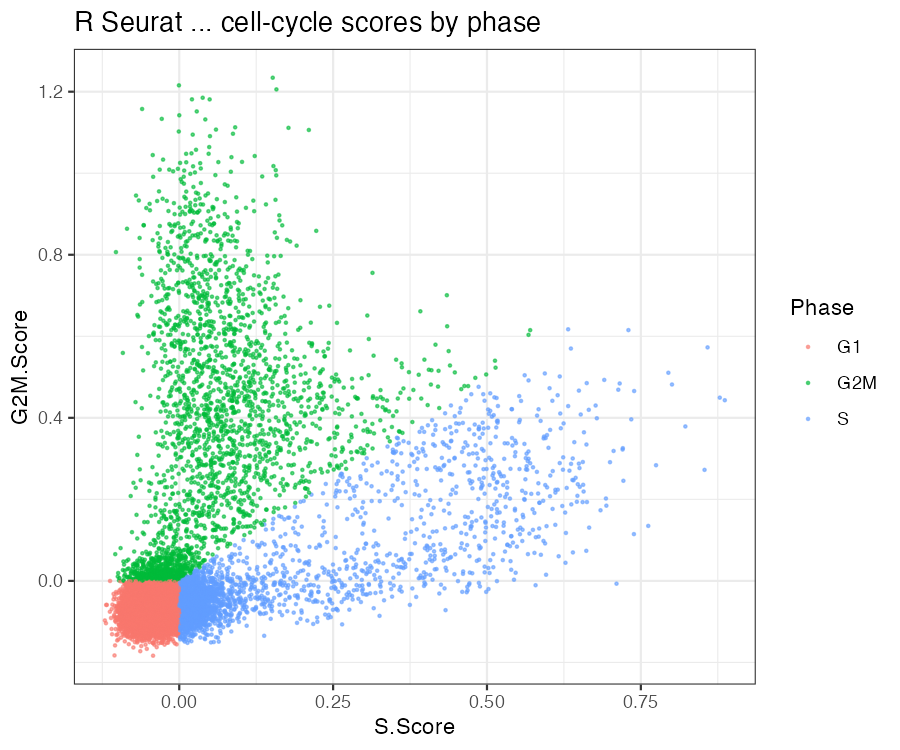
The classic read is S.Score against G2M.Score, coloured by the assigned
phase: G1 cells cluster near the origin (both scores ≤ 0), S cells fan out along
the x-axis, G2/M cells up the y-axis.
| R — scores by phase | Truecell — scores by phase |
|---|---|
 |
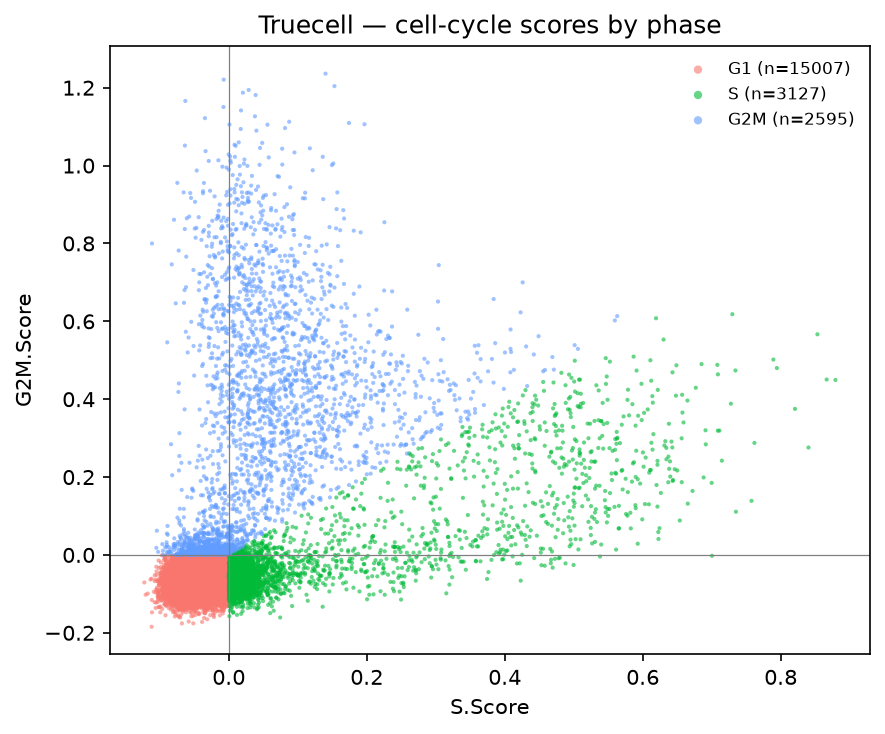 |
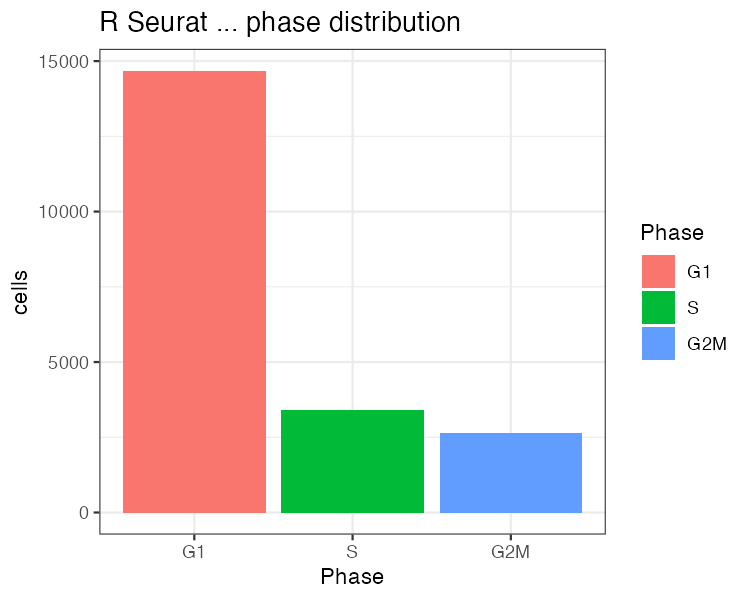
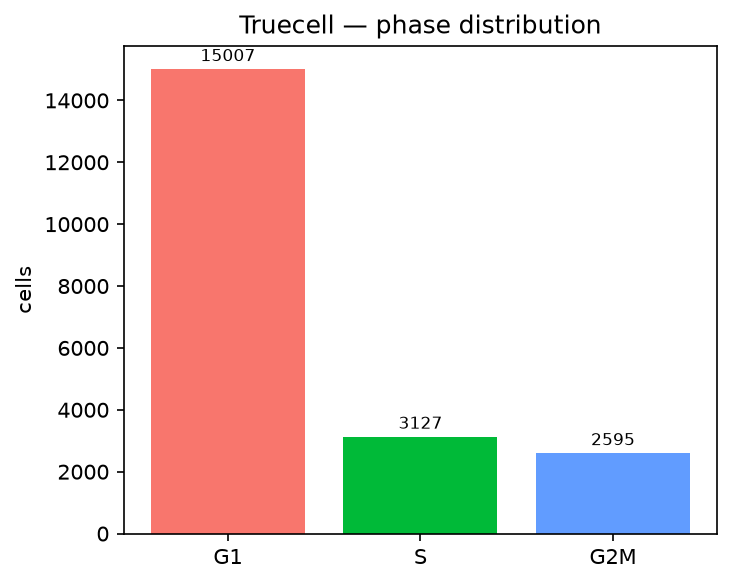
The phase split is the same on both sides — a genuinely cycling population, not the flat all-G1 that resting PBMCs would give:
| R — phase distribution | Truecell — phase distribution |
|---|---|
 |
 |
| phase | Truecell | R Seurat |
|---|---|---|
| G1 | 70.3 % | 70.8 % |
| S | 16.9 % | 16.5 % |
| G2M | 12.7 % | 12.8 % |
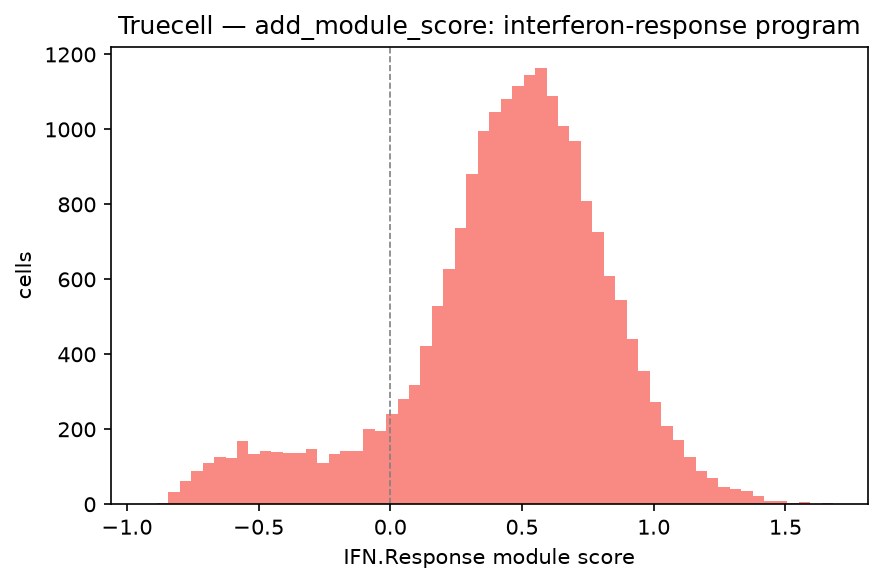
add_module_score on the interferon program produces the expected distribution —
most cells near zero, a positive tail of responders:
The headline · R-vs-Python concordance
Both functions sample control genes at random, and NumPy's RNG is not R's, so the per-cell scores are not expected to be identical — only to track. They track extremely tightly, and the discrete phase is robust to the residual wobble:
| metric | Pearson | Spearman |
|---|---|---|
S.Score |
0.9975 | 0.9766 |
G2M.Score |
0.9990 | 0.9773 |
IFN.Response (add_module_score) |
0.9995 | 0.9993 |
Per-cell Phase concordance: 0.9586 (19,870 / 20,729 cells). (Agreement with Papalexi's published phase — a different pipeline — is 0.86, for context.)
Why per-cell agreement is lower than it was
CellCycleScoring draws as many control genes per scored gene as the smaller
gene set has: 40 here, the S genes found on this panel. truecell used to pass
AddModuleScore's own 100. Matching Seurat moved the phase split onto R's
(72.4 / 15.1 / 12.5 % became 70.3 / 16.9 / 12.7 %, against R's 70.8 / 16.5 /
12.8 %) and lowered per-cell agreement from 96.62 % to 95.86 %.
The lower number is the ceiling the control draw sets, not a regression. With 40 controls, truecell agrees with itself across four NumPy seeds 95.75–95.88 % of the time, and with R 95.86–95.99 %. With 100 it agreed with itself 97.64–97.90 % but with R only 96.44–96.79 %, a point short of its own ceiling. That point was the parameter difference.
Taking the RNG out, so the algorithm can be checked exactly
The correlations above are the strongest result available while the control set is random — and that is a real limit, not a formality. A correlation of 0.9995 cannot separate a faithful port from one whose binning is subtly wrong, because binning error and sampling noise land in the same residual.
There is one regime where the randomness disappears. nbin = 1 puts every gene
in a single bin, and ctrl equal to the pool size then draws that whole bin:
sample(n, n) is a permutation, so the control set is forced and only its
summation order is free. Scored that way, the two tools must produce the same
number, not a correlated one:
| max |Δ| across 20,729 cells | |
|---|---|
nbin = 1, ctrl = pool (control set forced) |
6.66e-15 |
ctrl = 8 (bins ≈ 8 genes), two seeds in R alone |
1.8e-01 |
6.66e-15 is floating-point associativity over 18,649 genes — R shows 6.2e-15 between two of its own seeds in this regime, and truecell 3.6e-15. So the binning, the control-set selection and the mean subtraction are exact; the 0.9995 above is the RNG and nothing else.
There is no exact regime in the general case, which is worth stating so nobody
looks for one: cut() produces uneven bins, R errors if ctrl exceeds the
smallest bin's population, and no single ctrl both fits the smallest and
exhausts the largest.
Three programs in one call, at non-default settings
Everything above runs one program at a time at nbin = 24, with ctrl at
Seurat's 40 for the cell cycle and 100 for the interferon program. Scoring
S, G2/M and interferon in a single call at nbin = 12, ctrl = 40 exercises both
the multi-program path and settings nothing had used: Pearson 0.9972 / 0.9988 /
0.9986, with column order preserved. Order is the part worth pinning — programs
are identified by position alone, so a transposition would leave every
correlation high and every label wrong.
The scores correlate at Pearson ≥ 0.997 — the algorithm is faithfully ported, and
the only reason the numbers are not bit-identical is the random control set.
95.86 % of cells get the same phase call, and the ~4.1 % that differ sit right
on the phase boundary (S.Score or G2M.Score near 0), where the small
RNG-driven score shift tips the discrete call one way or the other — the same
boundary-sensitivity as Mixscape's weak guides. No defect found:
cell_cycle_scoring and add_module_score reproduce Seurat on their first
real-data benchmark, with a residual that is the documented control-gene RNG and
nothing more (the same "don't chase the RNG" spirit as clara and the MULTI-seq
KDE).
Running it yourself
python  tutorials/thp1_cellcycle_tutorial.py    # downloads ~66 MB (shared with Mixscape), writes gene lists
Rscript tutorials/thp1_cellcycle_verify.R       # Seurat reference → r_calls.csv + r_*.png
python  tutorials/thp1_cellcycle_tutorial.py    # re-run → prints the R-vs-Python concordance
python  tutorials/generate_cellcycle_plots.py   # Truecell figures → figures_cellcycle/py_*.png
Figures (tutorials/figures_cellcycle/, r_* = R Seurat, py_* = Truecell):
| Figure | Description |
|---|---|
py_01_score_scatter.png |
S.Score vs G2M.Score, coloured by assigned phase |
py_02_phase_bar.png |
Cell count per phase (G1/S/G2M) |
py_03_ifn_hist.png |
Interferon-response module-score distribution (AddModuleScore) |
R Seurat → Truecell API
| Task | R (Seurat) | Python (Truecell) |
|---|---|---|
| Module score | AddModuleScore(obj, features=list(program), name="X") |
add_module_score(obj, features={"X": program}) |
| Cell-cycle score | CellCycleScoring(obj, s.features, g2m.features) |
cell_cycle_scoring(obj, s_features, g2m_features) |
| Bundled cc genes | cc.genes.updated.2019$s.genes / $g2m.genes |
truecell.module_score.CC_GENES["s_genes"] / ["g2m_genes"] |
| Set phase as identity | CellCycleScoring(..., set.ident = TRUE) |
cell_cycle_scoring(..., set_ident=True) |
| Regress out cell cycle | ScaleData(obj, vars.to.regress=c("S.Score","G2M.Score")) |
scale_data(obj, vars_to_regress=["S.Score","G2M.Score"]) |
References
Tirosh I, Izar B, Prakadan SM, et al. (2016) Dissecting the multicellular ecosystem of metastatic melanoma by single-cell RNA-seq. Science 352, 189-196. https://doi.org/10.1126/science.aad0501
Papalexi E, Mimitou EP, Butler AW, et al. (2021) Characterizing the molecular regulation of inhibitory immune checkpoints with multimodal single-cell screens. Nature Genetics 53, 322-331. https://doi.org/10.1038/s41588-021-00778-2