The Differential-Expression Test Suite — R Seurat vs Truecell (Python)
Wave 3's first side-by-side, and the last large untested surface in the library:
find_markers offered eight statistical tests and none of them had ever been
compared to R. Their unit tests asserted self-consistency on synthetic fixtures —
the same shape of coverage that let the CLR and SCTransform defects survive. A
ninth, poisson, came in 1.2.0, and all nine are compared below.
Dataset: pbmc3k — 2,700 PBMCs, 10x Genomics (2016). The comparison runs on clusters 0 and 1 (703 and 480 cells, 13,714 genes). R reference: Seurat 5.5.1 · MAST 1.38.0 · DESeq2 1.52.0 · Python: Truecell
| Seurat | Truecell |
|---|---|
FindMarkers(obj, test.use = "wilcox") |
find_markers(obj, test_use="wilcox") |
test.use = "t" · "bimod" · "LR" |
test_use="t" · "bimod" · "LR" |
test.use = "negbinom" · "poisson" · "roc" |
test_use="negbinom" · "poisson" · "roc" |
test.use = "MAST" |
test_use="mast" |
test.use = "DESeq2" |
test_use="deseq2" |
This tutorial found and fixed two defects.
avg_log2FCput Seurat's pseudocount on the group mean rather than the group sum, which floored every fold change and — becauselogfc_thresholdfilters on that value — changed which genes were returned at all. Andnegbinomran a moment-dispersion likelihood-ratio test where Seurat runs an ML-dispersion Wald test. Both are written up in what this tutorial found.
Both tools test the same cells: Python clusters pbmc3k and writes the
assignment to figures_de/groups.csv, which the R side reads. Both run Seurat's
modularity optimiser, but each builds its own neighbour graph, and a clustering
difference would look exactly like a DE difference.
Headline
| Metric | Result |
|---|---|
avg_log2FC vs Seurat, all 13,714 shared genes |
max abs diff 1.78e-15 |
| Tests reproducing Seurat's top 50 genes | 8 of 8 p-value tests (roc scores AUC, not p) |
wilcox · t · bimod · LR — p-value Spearman |
1.000000 · 0.999977 · 0.999996 · 0.999977 |
mast — Spearman (all genes / detected >5%) |
0.9464 / 0.9993 |
negbinom — Spearman (all genes / detected >5%) |
0.9995 / 0.9999995 |
poisson — Spearman (all genes / detected >5%) |
0.9996 / 0.9999989 |
deseq2 — Spearman (all genes / detected >5%) |
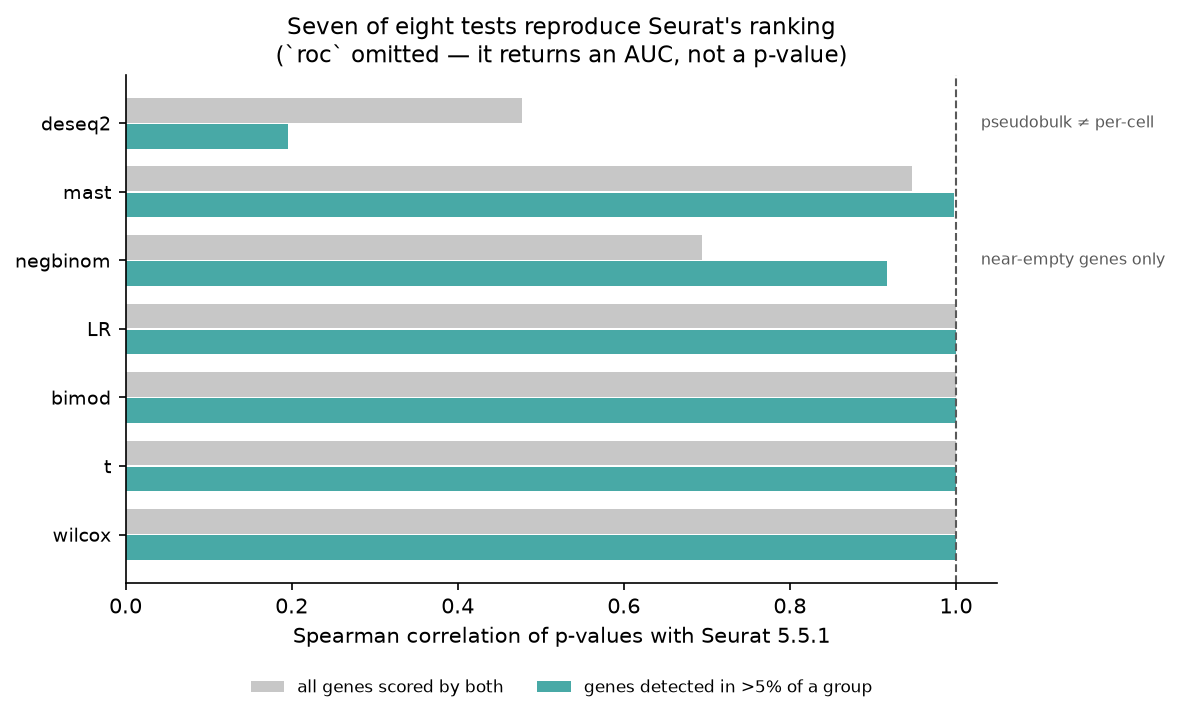
0.9992 / 0.9999991, and the same 712 genes at p_val_adj < 0.05 |
roc — max abs AUC difference |
5.0e-04, which is Seurat's own 3-dp rounding |
Before the fix — genes returned at logfc_threshold=0.25 |
truecell 2,299 vs Seurat 11,907 (Jaccard 0.193) |
These numbers are on the two clusters Seurat's optimiser finds, 703 and 480 cells. Where a section below traces how a defect was found, its numbers are from that day, on the earlier partition of 692 and 515 cells, and it says so.
Added later: poisson
The ninth test, added after the four waves closed. poisson is the other branch
of Seurat's GLMDETest — glm(family = "poisson") on the counts layer, Wald
p-value off the group coefficient — and it ports cleanly: 50/50 on the top
50, avg_log2FC to 1.8e-15, Spearman 0.9999989 on genes detected above
5 %, and not one gene on which the two tools disagree about p_val_adj < 0.05.
The residual is Seurat's, which has now happened three times in this port.
truecell's p-values agree to about six significant figures rather than bit-for-bit,
and the gap grows with significance — median |Δlog10 p| 1.7e-6 below
-log10 p = 2, and 9.8e-5 above 150. That is tail amplification, not a
different statistic: at z ≈ 37 a shift of 0.005 in z moves p by 20 %.
Traced on GPX1, the worst gene on the earlier partition:
| iterations | z | p | |
|---|---|---|---|
R, default glm.control(epsilon = 1e-8) |
5 | 37.002168 | 1.0568e-299 |
R, epsilon = 1e-14 |
6 | 36.997126 | 1.27368e-299 |
| truecell (statsmodels IRLS, already converged) | — | 36.997125 | 1.27372e-299 |
truecell matches R's converged coefficient to 14 significant figures; R's default tolerance stops an iteration short. Re-running the top 200 genes at both tolerances closes 9/10 of the median gap (5.9e-5 → 6.6e-6) and 57/58 of the worst case (8.1e-2 → 1.4e-3). truecell is the more converged of the two, so nothing was "fixed" to chase it — the same call as the Visium tutorial's radius-in-a-diameter-slot.
One divergence on the gene set, verified exactly. R returns 11,387 genes
where truecell returns 13,714. All 2,327 of the difference fail
GLMDETest's min.cells = 3-in-both-groups gate — fewer than 3 expressing
cells in each group, which no gene R keeps has — and R flags them with a
sentinel p-value of 2 and then deletes them; 437 are not expressed at all.
truecell returns them with p_val = 1 — no evidence rather than no row — so the
gene set stays identical across every test_use. The two sets were compared
gene-by-gene rather than assumed to line up.
Use negbinom instead unless you need the speed. Holding the dispersion at
1 asserts Var = mean, which UMI counts do not obey, so poisson's standard
errors are too small and its p-values too extreme. It is in truecell because it
is in Seurat.
Changed later: deseq2 runs Seurat's test
deseq2 used to sum counts per sample, and it required sample_col. Seurat's
DESeq2DETest gives DESeq2 one column per cell, so the two answered different
questions, and this page carried deseq2 as a divergence: 22 of the top 50,
Spearman 0.195 on detected genes. It now runs Seurat's test, every cell a
replicate. sample_col stays for a sample-level test: it sums each sample's
cells first, and those profiles go through the same test.
pydeseq2 fits DESeq2's model, but four of its choices change the answer, and each now follows DESeq2:
DESeq2, as DESeq2DETest calls it |
pydeseq2's default | |
|---|---|---|
| Dispersion trend | fitType = "local", a local regression |
parametric or mean |
| Gene-wise dispersion, flat likelihood | below 1e-6, so out of the trend fit | L-BFGS-B stops near 1e-5, inside it |
| Cook's outliers | p-value set to NA, no refit | counts replaced, genes refitted |
| Wald standard error | fitted means floored at 0.5 | no floor |
The local trend is written from the published method, not from locfit's GPL
source: a tricube-weighted local quadratic over the nearest 70 % of genes, each
weighted by its mean. It matches locfit evaluated at each gene to 8e-9 on the
test fixture; DESeq2 itself reads the trend off locfit's interpolation, up to
6e-3 away. The floor is what closed the gap per cell: without it truecell calls
652 genes, every one of them among Seurat's 712.
Seurat's FindMarkers wiring came across too — no logfc_threshold pre-filter
for DESeq2, Bonferroni over every feature, and the fold change from the data
layer, as for every other test.
| Per cell, on clusters 0 and 1 | |
|---|---|
| Top 50 | 50/50 |
| p-value Spearman, all genes / detected >5 % | 0.999241 / 0.9999991 |
Genes at p_val_adj < 0.05 |
712 in both, the same genes; one differs at 0.01 |
| Seurat's NA p-values (Cook's outliers and empty genes) | 593, each p = 1 in truecell |
avg_log2FC |
1.8e-15 |
The largest single-gene gap is CD14, 4.2 decades: 4.2e-150 in truecell against
2.5e-154 in Seurat. That far into the tail a small shift in the Wald z moves p by
decades, as in the poisson note above.
On Seurat's own pseudobulk vignette. The Frontiers revision compared the tools
on ifnb: 8 donors, 11 cell types, STIM against CTRL, both sides given the same
13,383 cells and identical aggregated counts. With find_markers called the way
the vignette calls FindMarkers, without sample_col:
| truecell 1.2.0 | truecell 2.0.0 | |
|---|---|---|
| Genes tested | 8,170 for CD14 monocytes against Seurat's 13,188 | identical in all 11 cell types |
DEG Jaccard at p_val_adj < 0.05 |
0.41–0.66 | 0.947–1.000, median 0.993 |
avg_log2FC |
DESeq2's log2FoldChange |
Seurat's, to 1.8e-15 |
This is where the flat-likelihood row of the table above was found. R's own DESeq2, with the trend evaluated at each gene as truecell evaluates it, agrees with Seurat at 0.981–1.000 (median 0.998).
Two consequences come from DESeq2 rather than truecell. Cells are not independent
replicates, so per-cell p-values are anti-conservative
(Squair et al. 2021): use this to
reproduce a Seurat analysis, and sample_col for a claim about conditions. And
DESeq2's size factors need a gene with no zero in any column. When there is none,
estimateSizeFactors stops, and find_markers raises too rather than switching
estimators. These two clusters have 7 such genes among 13,714.
Setup
Both sides then run with logfc.threshold = 0 and min.pct = 0, so the
comparison sees every gene rather than only those surviving a filter whose
input is one of the numbers under test. Seurat's defaults would have hidden
exactly the disagreement worth seeing.
Running the tests
Both columns are identical to seven significant figures — the same p-values and the same fold changes, on the same cells.
What this tutorial found
1. avg_log2FC put the pseudocount in the wrong place
Seurat 5's log1pdata.mean.fxn is, verbatim:
One pseudocount added to the group's sum, then divided by n — so on the mean
scale it is worth 1/n, not 1. truecell computed log2(mean(expm1(x)) + 1),
adding a whole count to the mean. That is Seurat 4's formula; the repo
targets Seurat 5.
The effect is to floor every fold change toward zero. A gene detected in 0 % of cluster 0 and 24 % of cluster 1 read −1.26 where Seurat reads −9.93.
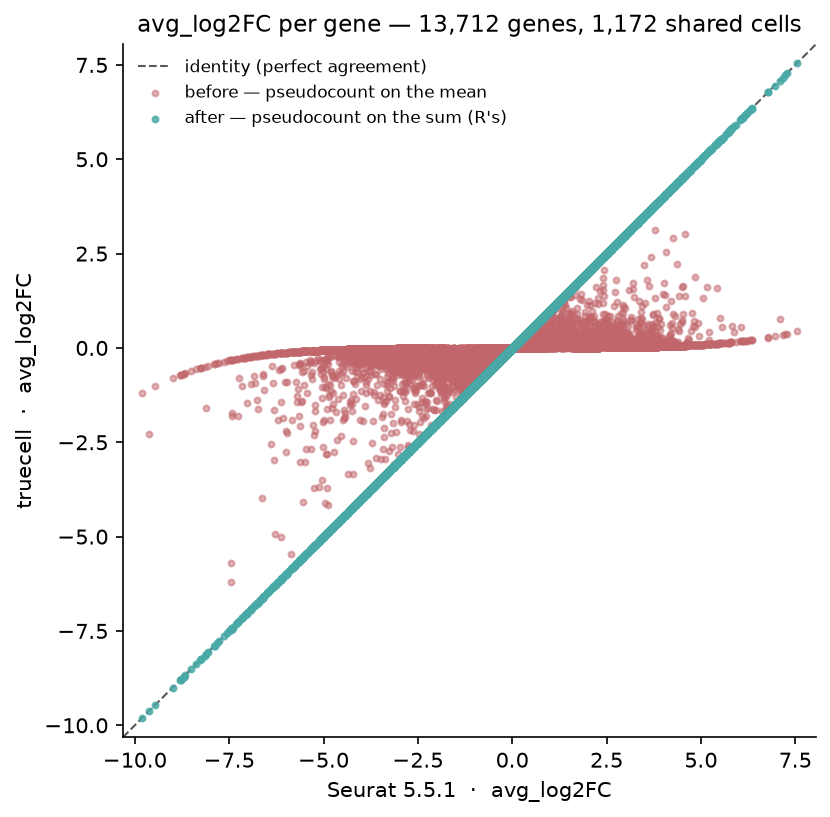
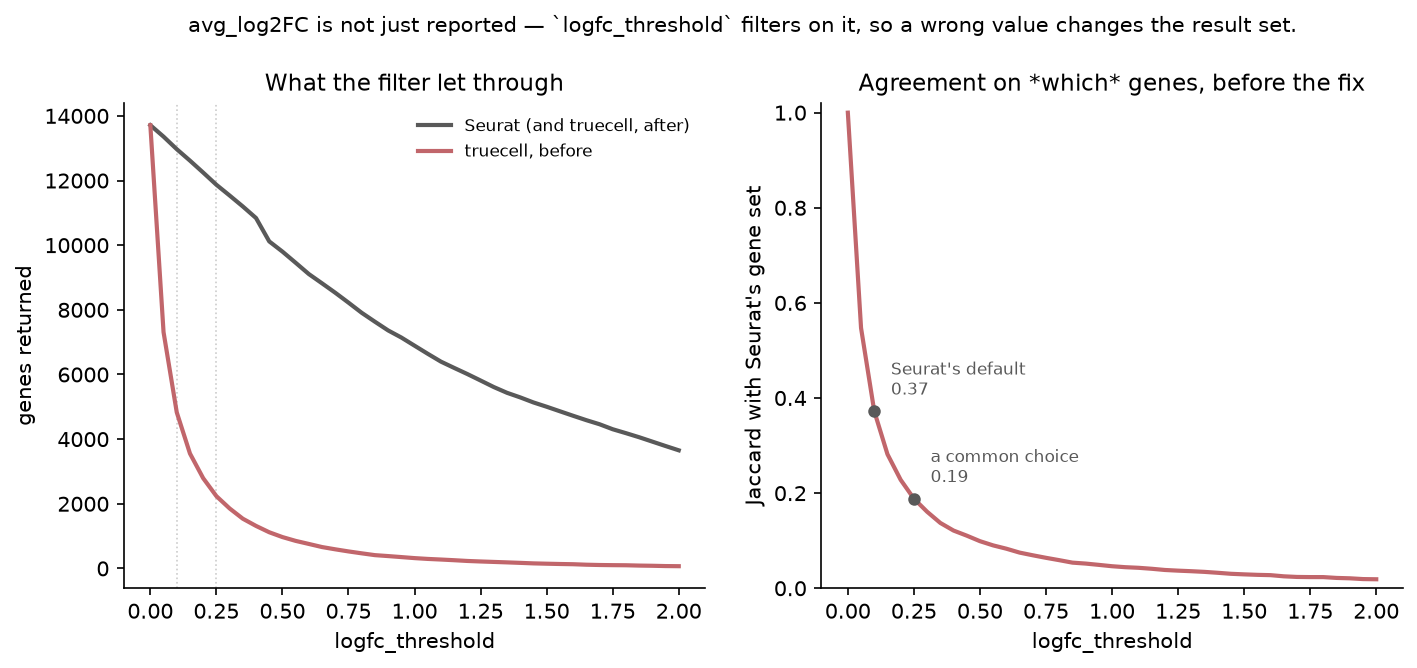
Why this is a defect and not a cosmetic difference. logfc_threshold
filters on this value, so the error did not merely misreport fold changes — it
changed which genes came back:
logfc_threshold |
truecell (before) | Seurat | Jaccard |
|---|---|---|---|
| 0.1 (Seurat's default) | 4,897 | 12,990 | 0.377 |
| 0.25 | 2,299 | 11,907 | 0.193 |
| 0.5 | 981 | 10,239 | 0.096 |
| 1.0 | 333 | 6,953 | 0.048 |
At a common 0.25 threshold, fewer than one gene in five agreed.
The most telling part: where both groups express a gene, the two formulas nearly agree (Spearman 0.990 on the 1,358 genes with pct > 0.1 in both). The error was concentrated in sparse, marker-like genes — precisely what differential expression exists to find. After the fix, 6.22e-15 across all 13,714 genes.
There was already a test for this. test_avg_log2fc_matches_seurat_formula
re-implemented the same wrong formula and checked that truecell agreed with
itself. It was green throughout while carrying a name that claimed Seurat
parity — the same shape as #48's test_fetch_data. It is corrected here.
2. negbinom was running a different test
Seurat's GLMDETest fits MASS::glm.nb — which estimates the dispersion by
maximum likelihood — and reads the Wald p-value off the group
coefficient (summary(...)$coef[2, 4]). truecell used a fixed method-of-moments
dispersion and a likelihood-ratio test: a different estimator and a
different statistic. HLA-DRA read 5.5e-128 against R's 1.1e-321.
The first fix called statsmodels' NegativeBinomial. That agreed with R only on
genes detected above 5 % (Spearman 0.92 there, 0.69 over every gene), and it had
a second problem, found later: its BFGS optimiser collapsed theta, or stopped
unconverged, on some genes, and which genes moved with the statsmodels version.
The Frontiers revision's fresh install, on statsmodels 0.15.0, read 49 of the top
50. truecell now fits glm.nb's estimator itself (truecell/_glm_nb.py), IRLS for
the coefficients alternating with maximum likelihood for theta. Its output is
the same bits under statsmodels 0.14.6 and 0.15.0, and against R:
| detection (max of the two groups) | genes | median |log10 ratio| | Spearman |
|---|---|---|---|
| > 25 % | 917 | 2e-10 | 1.0000 |
| 10 – 25 % | 1,474 | 7e-11 | 1.0000 |
| 5 – 10 % | 1,840 | 6e-10 | 1.0000 |
| 1 – 5 % | 4,918 | 4e-6 | 0.9998 |
| < 1 % | 2,224 | 1e-5 | 0.9857 |
No gene anywhere differs by more than 0.006 decades, and none lands on the other
side of p_val_adj = 0.05 or 0.01. The small spread left is in near-empty genes,
which Seurat does not report anyway: its min.cells.feature default drops them,
and in this run R returned 11,387 genes against truecell's 13,714 — every one of
the 2,327 it dropped was below 1 % detection in both groups (the highest reached
0.4 %).
Differences left standing, and why
mast is a hand-rolled hurdle model, not a call to the MAST package, which
has no Python equivalent to depend on. Spearman 0.946 across all genes, 0.9993
on genes detected above 5 %, and the same top 50. Worth knowing: Seurat's
MASTDETest fits ~ condition alone — it adds no cellular detection rate
term unless you pass one. truecell's docstring previously advised passing CDR "to
match Seurat's default CDR covariate", which had it backwards; that is corrected.
Seurat rounds myAUC to three decimals inside DifferentialAUC, so the ROC
comparison cannot be tighter than 5e-4 however correct both sides are. That is
R's rounding, not a divergence — stated because it looks like one.
Genes expressed in neither group get p = 1. truecell returns 1 for the 437
genes with no expression in either group, and so does Seurat when it runs
wilcox through presto, as it does for these references. Base R's
wilcox.test, which Seurat falls back to without presto, returns NaN for them.
A test that cannot be run has no evidence against the null, so 1 is the more
useful answer.
Without presto, R also returned exactly 0 for 172 genes on the earlier
partition, and that was not double underflow: truecell scored 92 of them above
1e-50, the largest — SEPT1 — at 9.3e-17. It was not Seurat's wrapper either.
Calling base R's wilcox.test on that gene's normalised row directly, outside
Seurat, returned 0 as well (W = 212196.5 on 692 vs 515 cells). Through presto, R
returns no zeros on these clusters. Rows R writes as NaN or 0 are excluded from
every correlation reported here, since neither carries a rank.
Parity — verified against R Seurat
| Test | Genes | max |Δlog2FC| | p Spearman (all) | p Spearman (detected >5 %) | Top 50 |
|---|---|---|---|---|---|
wilcox |
13,714 | 1.8e-15 | 1.000000 | 1.0000 | 50/50 |
t |
13,714 | 1.8e-15 | 0.999977 | 1.0000 | 50/50 |
bimod |
13,714 | 1.8e-15 | 0.999996 | 1.0000 | 50/50 |
LR |
13,714 | 1.8e-15 | 0.999977 | 1.0000 | 50/50 |
negbinom |
11,387 | 1.8e-15 | 0.999544 | 1.0000 | 50/50 |
poisson |
11,387 | 1.8e-15 | 0.999623 | 1.0000 | 50/50 |
roc |
13,714 | 1.8e-15 | AUC 5.0e-04 | — | — |
mast |
13,714 | 1.8e-15 | 0.946414 | 0.9993 | 50/50 |
deseq2 |
13,714 | 1.8e-15 | 0.999241 | 1.0000 | 50/50 |
Re-measured when
find_clustersbecame Seurat's own optimiser, which changed the two clusters from 692 and 515 cells to 703 and 480. The notes below were written on the earlier clusters.R's side of every column is read from the hex-float tables
pbmc3k_de_verify.Rwrites, not its 15-digit CSVs. That took the fold-change bound from 6.2e-15, which was R's formatter, to 1.8e-15, and movednegbinom's all-gene Spearman in the sixth decimal place anddeseq2's in the fifth.13,714 rather than the 13,712 an earlier version of this table showed: two genes,
Y-RNAandRP11-442N24--B.1, used to be spelled with underscores on the truecell side, until its factories adopted Seurat's_→-rule. Only themastanddeseq2all-gene Spearman moved with them.The detected >5 % column moved for
mast(0.9979 → 0.9980), and fornegbinombefore its fit was replaced, when truecell began roundingpct.1andpct.2to three decimals, as Seurat'sFoldChangedoes. That column's genes are picked from the Python table's detection rates, and 69 genes detected in exactly 26 of cluster 1's 515 cells (5.05 %, which Seurat reports as 0.050) had been let in on that rate alone. Both tables now carry identical rates, so both pick the same genes.The last digits of these moved slightly when the CSV round-trip was fixed (see The two columns a person actually reads, below): they had been read back through a misparsing float reader. The change is at the ULP level and no band moved, but the table is the measured one, not the previous one.
Re-measured before 2.0.0 with both sides re-run together, which moved the all-gene Spearman of
LR,negbinom,mastanddeseq2in the fifth or sixth decimal place.poisson's rows, which this table and the next one had left out, are added.
deseq2's row moved when it began running Seurat's per-cell test; see
Changed later near the top.
The two columns a person actually reads
The table above scores the statistic. It does not score the two numbers someone annotating clusters looks at: the fold change they sort by, and the adjusted p-value they threshold on. Neither was compared until an expert reviewer pointed out that the max-difference bound and a set overlap answer neither question.
| Test | logFC Spearman | logFC Kendall | Top 50 by |logFC| | p_val_adj to 6 s.f. |
Same call at 0.05 | Genes differing |
|---|---|---|---|---|---|---|
wilcox |
1.000000 | 1.000000 | 50/50 | 0.9932 | 1.0000 | 0 |
t |
1.000000 | 1.000000 | 50/50 | 1.0000 | 1.0000 | 0 |
bimod |
1.000000 | 1.000000 | 50/50 | 0.9996 | 0.9999 | 2 |
LR |
1.000000 | 1.000000 | 50/50 | 0.9909 | 1.0000 | 0 |
negbinom |
1.000000 | 1.000000 | 50/50 | 0.9809 | 1.0000 | 0 |
poisson |
1.000000 | 1.000000 | 50/50 | 0.8538 | 1.0000 | 0 |
roc |
1.000000 | 1.000000 | 50/50 | — | — | — |
mast |
1.000000 | 1.000000 | 50/50 | 0.8556 | 0.9973 | 37 |
deseq2 |
1.000000 | 1.000000 | 50/50 | 0.9415 | 1.0000 | 0 |
Rank correlation is reported alongside the max-difference bound rather than instead of it, because the two fail differently. A uniform scale error leaves every rank perfect and blows up the max; a handful of swapped mid-table genes leaves the max tiny and moves the ranks. Here both are clean: fold-change order is preserved exactly for all nine tests.
Do identical adjusted p-values occur? Mostly not, and the reason is worth
stating rather than the rate. The correction is identical — both tools compute
min(p × 13,714, 1), which holds bit-exactly on both sides — but the raw
p-values feeding it differ by up to 0.61 % relative on wilcox, a real
difference between SciPy's Wilcoxon and Seurat's, so the product rarely lands on
the same double. What survives that is what matters: the ordering is exact, and
every gene falls on the same side of 0.05 for wilcox, t, LR, negbinom, poisson
and deseq2.
Two traps in measuring this, both of which had to be fixed before the numbers above meant anything:
- Seurat clamps
p_val_adjat 1, and 11,948 of 13,714 genes land there. A bare "fraction identical" therefore reads ≈0.87 before a single interesting gene is considered.--reportscores the unclamped subset separately. - Neither side's CSV round-tripped a float64. R's
write.csvrenders 15 significant digits, and raising it does not help — R's ownsprintf("%.17g")is not correctly rounded and emits digits denoting a different double. Pandas'read_csvmisparses about a third of random doubles by an ULP at its defaultfloat_precision. So the R side now also writesr_<test>_exact.csvin C99 hex float (%a, a transcription of the IEEE-754 bits rather than a decimal approximation of them), and the Python side reads withfloat_precision="round_trip". Before that, an "is it identical" comparison was measuring the two languages' text formatters.
These numbers are asserted, not just printed
Every row above used to live only in this file, so nothing failed when one
moved. deseq2's overlap was written here as 25/50 and had drifted to 22 —
the clusters this tutorial tests are found by find_clusters, and the graph
fixes in #67-#71 moved a few cells between them. That is a legitimate reason for
the number to change, which is exactly why it needed a band rather than a
sentence: a regression landing on 22 would have read the same way.
--report now checks each number against a declared range and exits non-zero
if one falls outside:
| band | range | why |
|---|---|---|
| top 50, the eight p-value tests | = 50 | Same statistic, same cells. One dropped gene is a regression. At deseq2's cut the 50th and 51st genes sit 5.0 decades apart in truecell and 4.9 in Seurat, and no gene within three ranks of it differs by more than 0.05. |
p Spearman >5 %, wilcox/t/bimod/LR |
≥ 0.9999 | Measured at 1.0 to nine decimal places. |
p Spearman >5 %, negbinom |
≥ 0.9999 | glm.nb's own estimator: 0.9999995. It was 0.9217, and set at ≥ 0.88, while negbinom ran statsmodels' fit. |
p Spearman >5 %, mast |
≥ 0.99 | A hand-rolled hurdle model, not the MAST package: 0.9993. |
p Spearman >5 %, deseq2 |
≥ 0.9999 | DESeq2's Wald test on the same cells: 0.9999991. |
| max |Δlog2FC|, every test | ≤ 1e-12 | Arithmetic on the shared matrix, and every test, deseq2 included, reports Seurat's fold change. |
max |ΔAUC|, roc |
≤ 5e-4 | Half a unit in Seurat's third decimal. Measured exactly 5e-4 once the subtraction's last few ULPs are rounded off, i.e. on the boundary. |
The reference has to be the one the handoff asked for
--report also refuses to compare against an R run that predates the
groups.csv it was supposed to answer. This is not hypothetical: on the working
copy where these bands were written, the Python tables were from 25 July and the
R tables from 19 July, taken on a different cluster assignment — and the
report printed a full parity table showing wilcox at 48/50 and a Spearman of
0.907. Nothing in it said "stale file"; it read as a regression in the port.
The check is pct.1 and pct.2. They are counts of detected cells per group
with no statistics in the way, so two runs over the same handoff agree to
Seurat's three-decimal rounding and no worse. They differed for 12,491 of
13,712 genes.
Runtime, for scale: Seurat's slowest test here is negbinom at 91.6 s
(MAST 63.8 s, DESeq2 61.8 s); truecell's are 50.8 s, 29.1 s and 7.8 s.
negbinom took 35.7 s while it ran statsmodels' fit, and DESeq2 is now per cell,
as Seurat's is.
Running it
# 1. Python side — writes figures_de/groups.csv and py_<test>.csv
python tutorials/pbmc3k_de_tutorial.py

# 2. R side — writes figures_de/r_<test>.csv (needs MAST + DESeq2)
Rscript tutorials/pbmc3k_de_verify.R

# 3. Compare
python tutorials/pbmc3k_de_tutorial.py --report

# 4. Figures
python tutorials/generate_de_plots.py
The R side needs MAST and DESeq2:
Not glmGamPoi. It is a Suggests of DESeq2 rather than an Imports,
FindMarkers never calls it, and installing it flips sctransform's vst onto
a different backend — which would move the SCTransform R reference that
sctransform_vignette.md is pinned against.
Installing with default dependencies leaves Suggests alone, which is what you
want. This was verified rather than assumed: an SCTransform fingerprint taken
before and after the install is byte-identical.