Out of Core: LazyMatrix against BPCells
Dataset — pbmc3k, 13,714 features × 2,638 cells (10x Genomics, 2016)
R side — Seurat 5.5.1 + BPCells 0.3.1 · tutorials/lazy_bpcells_verify.R
Python side — tutorials/lazy_bpcells_tutorial.py
What this compares, and what it cannot
Seurat's answer to a matrix that does not fit in memory is BPCells: a
bitpacked on-disk format plus a deferred operation graph. LogNormalize,
VST and ScaleData are queued rather than executed, and nothing is
materialised until a reduction asks for a number. Seurat ships dedicated
IterableMatrix methods for exactly the functions that touch the matrix —
fourteen of them, including .CalcN, LogNormalize, VST, ScaleData,
RunPCA, FindMarkers and LeverageScore.
truecell's LazyMatrix is a different design aimed at the same problem: three
memory-mapped .npy arrays in CSC layout, with the analysis functions streaming
over them a block of cells at a time. It is lazy in storage, not in
operations.
So this is not a port comparison. There is no LazyMatrix inside Seurat to
match value-for-value, and no amount of tolerance-fiddling would make one. What
can be compared, and is:
- Do the two tools compute the same analysis out of core?
- Does each tool agree with itself — does moving a matrix to disk change the answer it gives?
- What does each format cost on disk?
The second question turned out to be the interesting one.
Result
14 of 14 compared anchors match, 7 of them exactly. truecell's out-of-core pipeline reproduces Seurat's in-memory pipeline to ~1e-15 on normalisation, mean, variance and scaled data, and selects 1998 of Seurat's 2000 variable features.
But the headline is the control, which is Seurat run against itself:
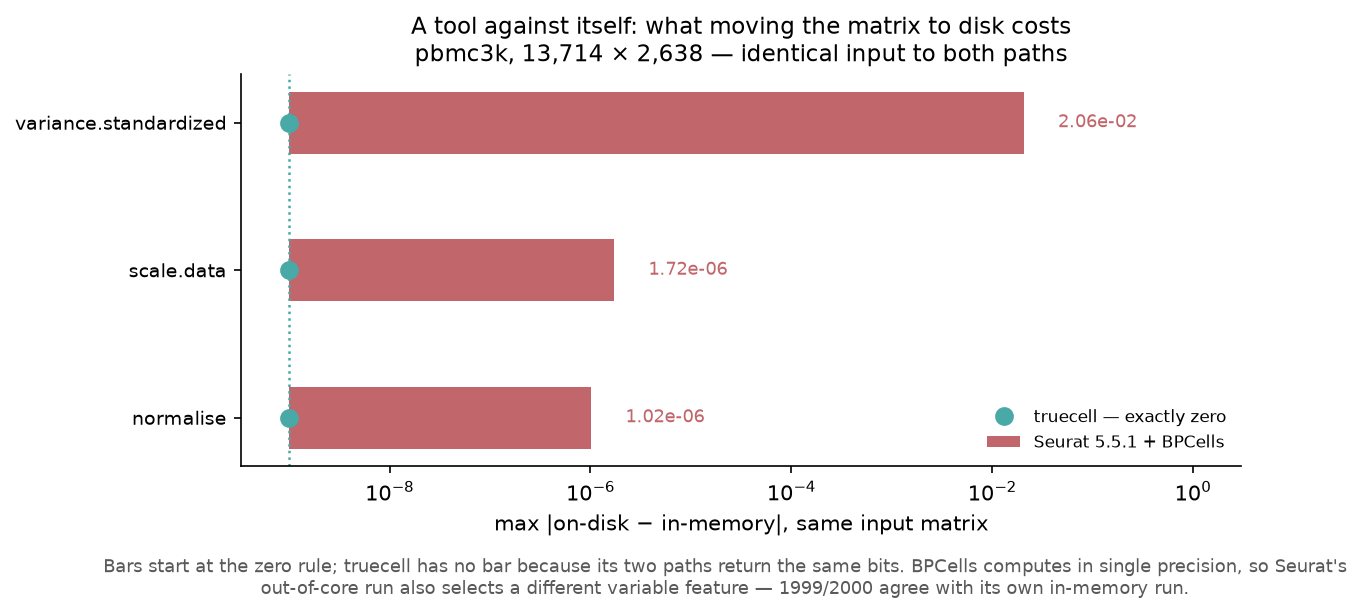
| on-disk vs in-memory, same input | truecell | Seurat 5.5.1 + BPCells |
|---|---|---|
| normalised values | 0 — bit-identical | 1.02e-06 |
scale.data |
0 | 1.72e-06 |
variance.standardized |
0 | 2.06e-02 |
| variable features agreeing with own in-memory run | 2000 / 2000 | 1999 / 2000 |
| DE tests supported out of core | all 8 | wilcox only |
Seurat's own two paths disagree. BPCells computes in single precision, so moving a matrix to disk changes Seurat's numbers and changes which gene it calls variable. That is not a bug — it is the price of a format built for matrices where single precision is the right trade — but it is worth knowing before assuming an on-disk run reproduces an in-memory one.
truecell's two paths are bit-identical. That is not luck: it is the direct result of a decision made while building this, described under One implementation, not two below.
The one real residual
variance.standardized differs from Seurat by 7.6e-3. It traces cleanly:
variance.standardizedis proportional to1 / variance.expectedvariance.expectedis10^loess_fitted- truecell's
_loess2is a NumPy local-quadratic fit; R'sloessis the cloess Fortran with kd-tree interpolation - the two differ by up to 2.5e-2 on the expected variance
The inputs are not in question — mean and variance agree to 1.5e-13. This is
a pre-existing smoother difference and has nothing to do with going out of core.
It is the reason vst_selected_head is reported rather than matched: genes whose
standardized variance sits within 7.6e-3 of each other reorder, so the head of
the ranked list is not a stable comparison. The set is, and 1998/2000 agree.
What the work found
Assessing whether this tutorial was even possible turned up seven defects. None was in code anyone suspected; all of it returned plausible output.
The out-of-core path densified everything
Five functions read a lazy layer through np.asarray(whole)[idx] when
subsetting first would have been cheap — _log_normalize, _vst_hvg,
scale_data, find_markers, add_module_score. percentage_feature_set did
not merely densify, it crashed: sp.issparse(LazyMatrix) is False so it
took the dense branch, but indexing a LazyMatrix returns scipy, whose
.sum(axis=0) is a (1, n) matrix rather than a vector.
The result was that backing a matrix on disk made things worse:
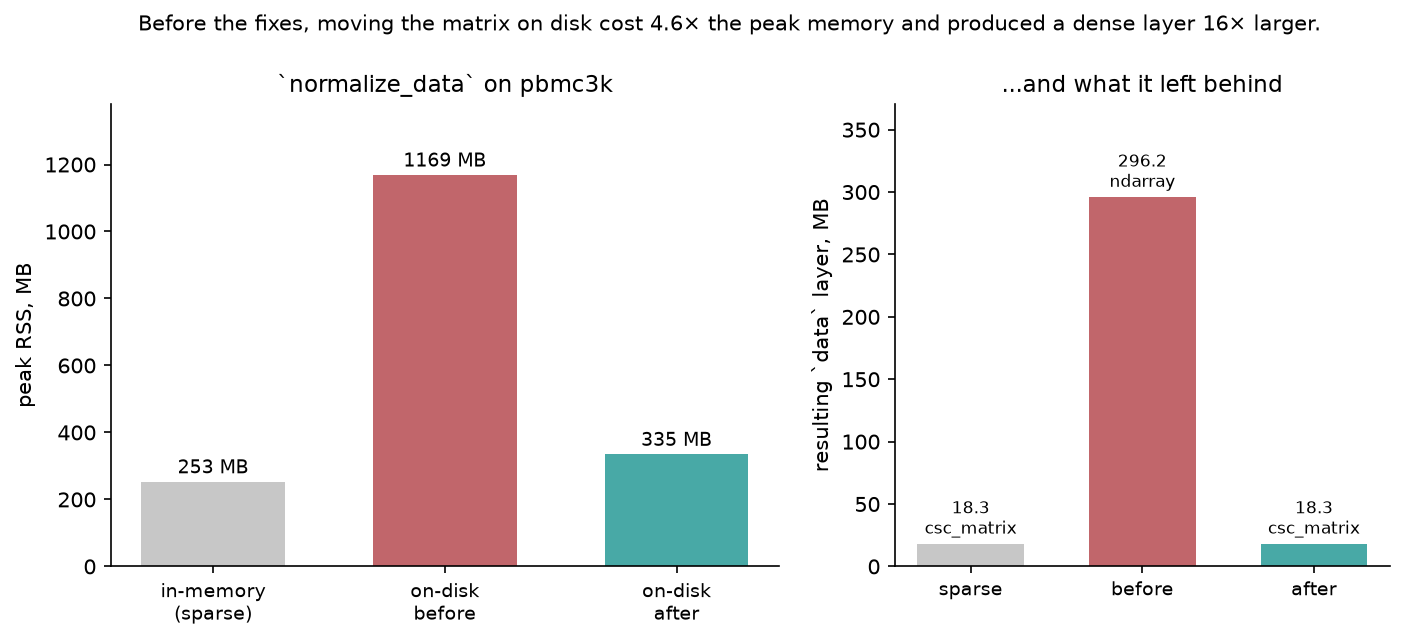
normalize_data on a lazy layer used 4.6× the peak memory of the sparse
path and left behind a dense ndarray 16× larger than the sparse layer it
replaced. The very first step of every pipeline destroyed the property the
feature exists for.
col_blocks — which the module docstring calls "the primitive for an
out-of-core reduction" — had no callers at all.
The constructor ended laziness before analysis began
create_assay5_object ran sp.csc_matrix(np.asarray(matrix)) on anything not
already scipy, and calc_n densified again to compute nCount/nFeature. So
the obvious way to use the feature — open a store, build an object on it — was
the one path that could not work.
This was found only because a memory measurement came out backwards. Every test
written up to that point swapped a layer in after construction, which is the
unnatural path, and missed it. Seurat has a .CalcN.IterableMatrix for exactly
this reason.
_loess2 was chaotically sort-dependent
Pre-existing, unrelated to laziness, and the largest of the set.
On pbmc3k 85.5 % of genes share their log10(mean) with another gene —
13,714 genes over only 2,837 distinct values, the largest tied run being 627
genes. np.argsort defaults to unstable quicksort, and the LOESS window was
chosen by position in the sorted array. So members of a tied run received
different neighbourhoods and therefore different fitted values.
R's loess cannot do that: a fitted value is a function of x alone. Measured
spread of fitted values within a single tied x:
| within-tie spread | |
|---|---|
R loess |
1.8e-15 (interpolation noise) |
| truecell, before | 1.3e-3 |
| truecell, after | 0 |
And the sensitivity that followed from it: perturbing x by 1e-15 moved
fitted values by up to 28.8 %, affecting 10,615 of 13,714 genes. Any
difference in BLAS, summation order or platform was enough to move the HVG
statistics.
The fix evaluates the fit once per distinct x, chooses neighbourhoods by
distance rather than position, and sorts lexicographically so tied runs order
themselves by y. Checked against R before being adopted:
median |diff| vs R loess |
correlation | |
|---|---|---|
| before | 0.000333 | 0.99999757 |
| after | 0.000103 | 0.99999933 |
It moved toward R. Of the 6 genes it swapped in HVG selection, all 6 it added are ones Seurat picks, and only 1 of 6 it dropped was — overlap with Seurat 99.65 % → 99.90 %.
A related one: argsort(v)[::-1] breaks ties by descending index, where R's
head(order(x, decreasing = TRUE), n) breaks them ascending. Both HVG selectors
now use argsort(-v, kind="stable").
One implementation, not two
The first version of the streaming path ran a block reduction for lazy layers and scipy's row reduction for sparse ones. They agreed to 1e-14, which sounds like enough.
It is not. variance.standardized carries exact ties; a tie-break decides which
of two tied genes is selected; and genes tied under one summation order are not
tied under the other. On pbmc3k that reordered 147 of 2000 features, changed
the PCA row order, and produced 9 clusters against 8.
Both layer types now go through the same block reduction, so the two paths cannot disagree — which is what makes the bit-identical column in the table above true. It also changed the in-memory path's numbers, so that was re-verified against R: the 99.90 % HVG overlap is post-unification.
The general shape is worth naming, because it recurs: when a computed
statistic feeds a filter or a tie-break, agreement "to 1e-14" is not agreement.
The same lesson produced the avg_log2FC finding in the DE tutorial, where a
wrong fold change changed which genes logfc_threshold returned.
Where truecell loses
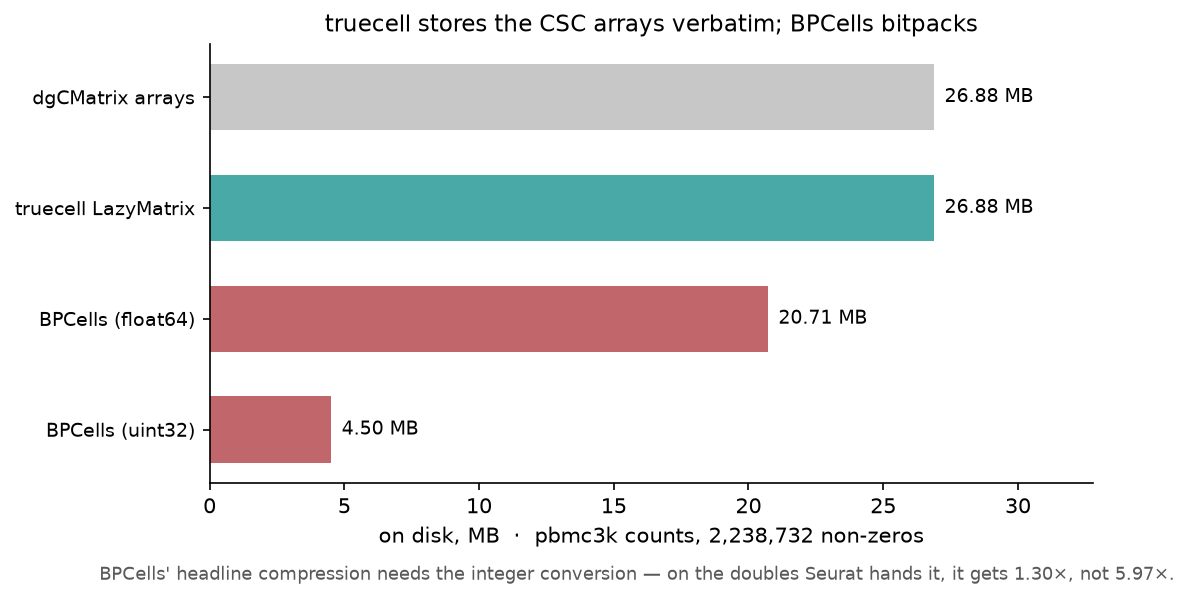
truecell writes the three CSC arrays verbatim, so the store is the size of the matrix — 1.00×, mmap laziness with no size reduction. BPCells bitpacks.
| store | pbmc3k counts |
|---|---|
| dgCMatrix arrays (float64) | 26.88 MB |
truecell LazyMatrix |
26.88 MB |
| BPCells, bitpacked float64 | 20.71 MB |
| BPCells, bitpacked uint32 | 4.50 MB |
6.0× more disk. Two honest qualifications. First, BPCells' headline
compression needs the integer conversion — on the doubles Seurat hands it, it
manages 1.30×, not 5.97×. Second, the cheap half of the gap is available to
truecell: storing counts as uint32 rather than float64 takes 26.88 MB to
17.92 MB. The remaining 4× is BP128 SIMD delta encoding, which is a format,
not a tolerance — implementing it is a project of its own and is not done
here.
Two other design differences the R side names:
FindMarkerson an IterableMatrix supportswilcoxalone. Everything else raises. truecell runs eight of its nine tests on a lazy layer (this tutorial predatespoisson; the point stands — Seurat allows one).- Seurat warns that column-major storage is the wrong orientation for DE and
recommends
transpose_storage_order(). truecell'sLazyMatrixis CSC — cell-major — with no row-major option. Its own docstring already flagged this as "a natural future extension"; the R side confirms it matters.
Reproducing
# Python side — writes anchors and the cell list
python tutorials/lazy_bpcells_tutorial.py

# R side — needs BPCells, which is not on CRAN and needs libhdf5 at build time
brew install hdf5 pkg-config
Rscript -e 'remotes::install_github("bnprks/BPCells/r")'
Rscript tutorials/lazy_bpcells_verify.R

# compare
python tutorials/lazy_bpcells_tutorial.py --report

# figures
python tutorials/generate_lazy_plots.py
On installing BPCells
glmGamPoi is the precedent for treating an R install as a hazard: a Suggests
of DESeq2 that FindMarkers never calls, whose mere presence flips
sctransform's vst onto a different backend and moves the SCT reference.
BPCells is not that shape. Every reference to it inside Seurat is gated on
inherits(x, "IterableMatrix") — dispatch on the matrix type — never on
requireNamespace. A dgCMatrix cannot enter a BPCells branch. Verified rather
than assumed: ten Seurat references were fingerprinted before and after
installing it, covering NormalizeData, FindVariableFeatures, ScaleData,
RunPCA, FindNeighbors/FindClusters, FindMarkers and SCTransform.
None moved.
One correction to the record: BPCells hard-requires HDF5. Its configure
script aborts rather than building without it, even though the HDF5 readers are
not needed when the store is written from a dgCMatrix.
A note on measurement
Three of the five initial anchor mismatches were an artefact of the R script's own JSON serialisation, which rounded to 10 decimal places. For a mean of 0.0034 that is a 2.9e-8 relative floor — larger than several of the differences under test:
| anchor | with the rounding | true |
|---|---|---|
normalize_head |
2.32e-11 | 2.85e-15 |
vst_mean_head |
2.59e-08 | 3.81e-15 |
vst_variance_head |
3.85e-08 | 3.65e-15 |
They would have been reported as findings. The tolerances in
lazy_bpcells_tutorial.py are each set one decade above a measured residual,
and test_lazy_bpcells_parity.py asserts none exceeds 1e-2.