Anchor internals — the v4 and v5 anchor paths vs Seurat
Dataset — ifnb (Kang et al. 2018); v4 section: a fixed 2,400-cell subsample
(CTRL 1,200 / STIM 1,200); v5 section: the full 13,999 cells (CTRL 6,548 /
STIM 7,451) · 2,000 shared anchor features throughout
R side — Seurat 5.5.1 · tutorials/anchors_verify.R (v4, nn.method = "rann",
exact neighbours) · tutorials/ifnb_integration_verify.R (v5)
Python side — tutorials/anchors_tutorial.py (v4) ·
tutorials/ifnb_integration_tutorial.py (v5)
Why a second integration tutorial
The integration vignette compares clusterings: it asks whether the two tools recover the same structure once the batch effect is gone. That is the right end-to-end question, and it is also lossy. A partition can agree while the anchors underneath it do not — cluster labels survive a great deal of damage before an adjusted Rand index notices.
This tutorial compares the anchors themselves: which mutual-nearest-neighbour pairs each tool calls an anchor, what score it gives them, and what the corrected expression of the query half comes out as.
Asking that question found twelve defects in the v4 path below, and — treating
what looked like the residual "implementation gap" on v5's IntegrateLayers
as a claim to check rather than a place to stop —
two more.
Result
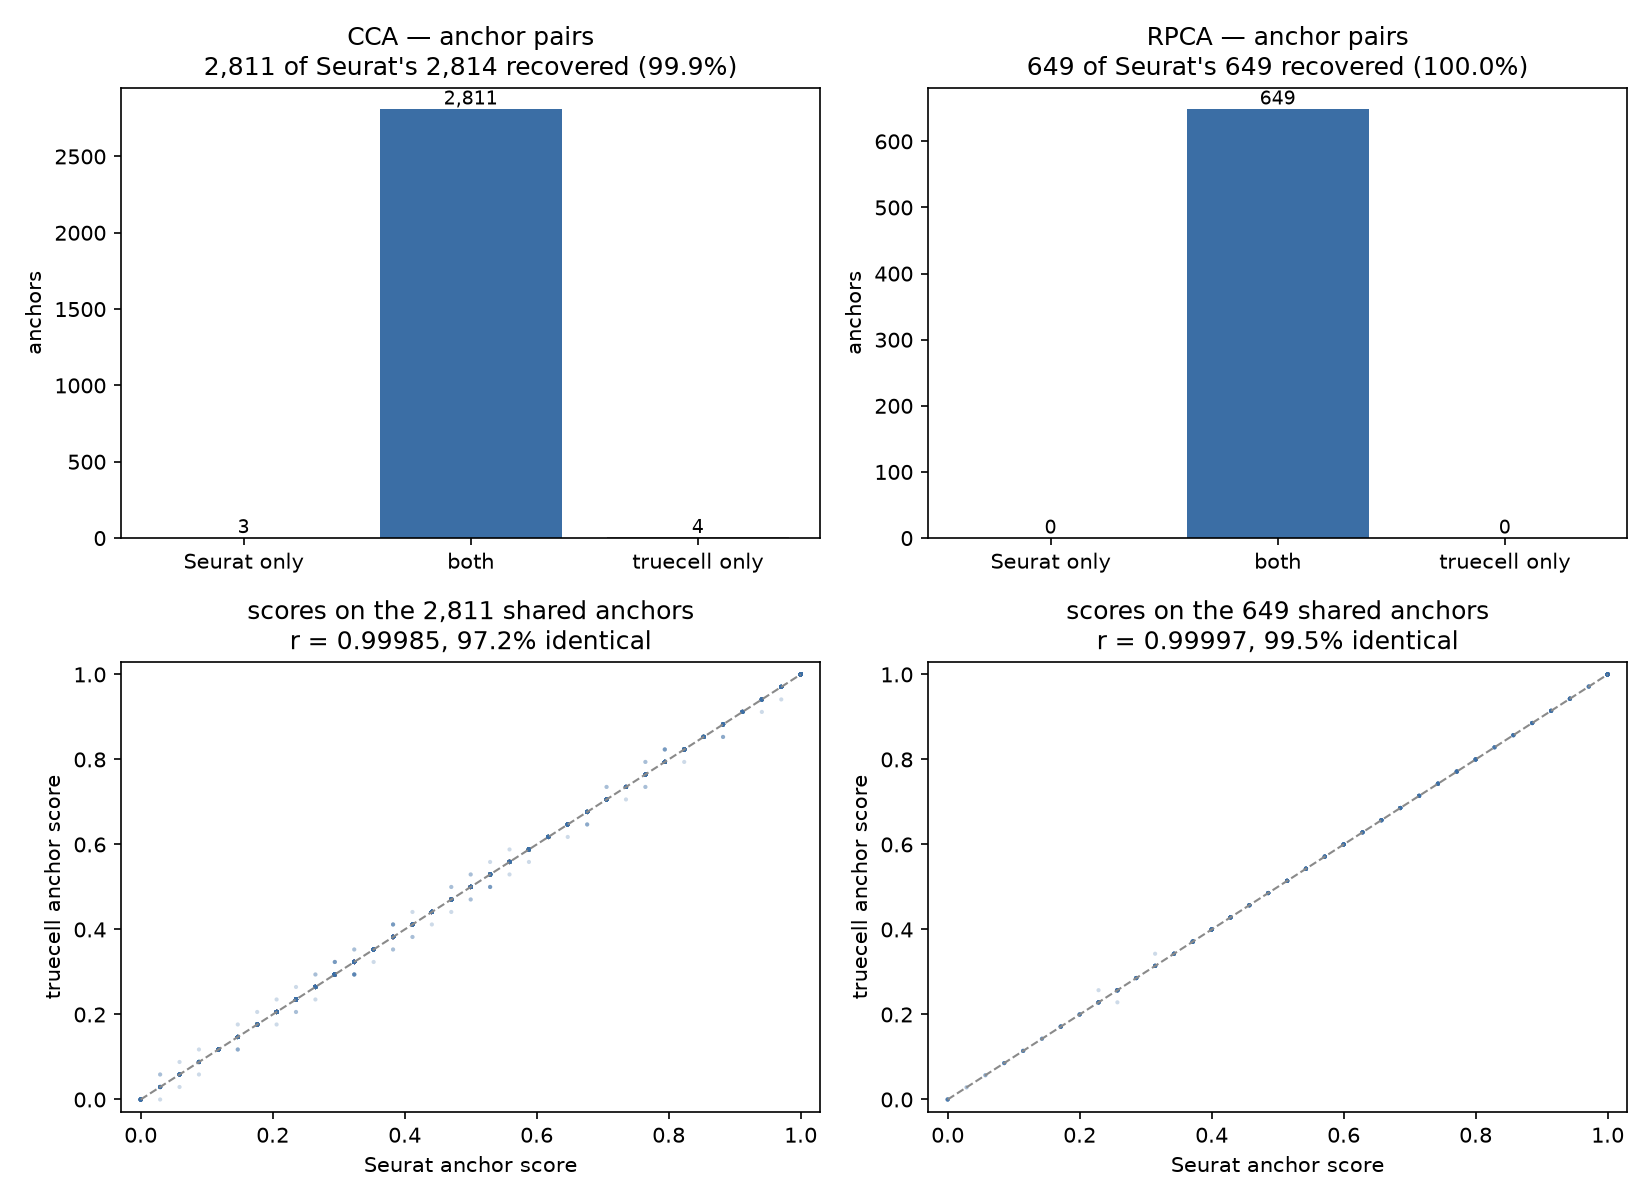
| Seurat | truecell | shared | recall | precision | score r | identical | |
|---|---|---|---|---|---|---|---|
| CCA | 2,814 | 2,815 | 2,811 | 99.9 % | 99.9 % | 0.99985 | 97.2 % |
| RPCA | 649 | 649 | 649 | 100.0 % | 100.0 % | 0.99997 | 99.5 % |
RPCA agrees on every anchor, and on 99.5 % of them the score is identical to the last bit. Before this work CCA recovered 70.0 % of Seurat's anchors at 60.3 % precision.
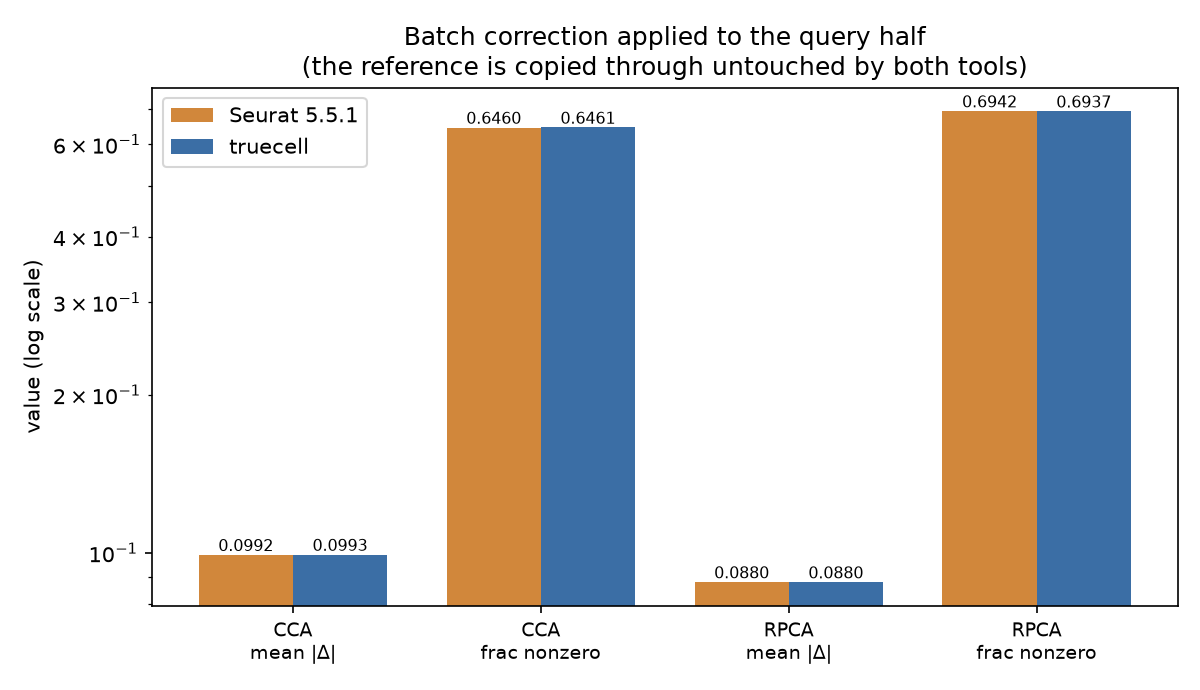
| correction over the query half | truecell | Seurat |
|---|---|---|
| CCA mean |Δ| | 0.099286 | 0.099201 |
| CCA fraction of entries moved | 0.6461 | 0.6460 |
| RPCA mean |Δ| | 0.087997 | 0.088026 |
| RPCA fraction of entries moved | 0.6937 | 0.6942 |
Reading Seurat rather than guessing it
Two of these functions are compiled, so their behaviour was pinned by calling them directly with controlled inputs rather than inferred from the R wrappers:
FindWeightsC   w = 1 − exp(−d̃ · score / (2/sd)²)      where d̃ = 1 − d/dₖ
IntegrateDataC corrected = query − Wᵀ (query − ref)
Both reproduce to max|diff| = 0 on random input. The kernel matters: it rises
with proximity and folds the anchor score into the exponent. A Gaussian in
the raw distance multiplied by the score — which is what truecell had — is a
different curve with a different ranking, and it even responds to its bandwidth
in the opposite direction.
The twelve
find_integration_anchors
RunCCAstandardizes each cell; truecell L2-normalized it. The dominant one. A cross-covariance of standardized matrices is a correlation matrix between cells; of L2-normalized ones, cosine similarity. Different singular vectors, so every anchor moves. Recall alone: 70.0 % → 86.5 %.CheckFeatureswas missing.RunCCAsilently drops anchor features that are constant in either object — 83 of 2,000 here. Standardizing works down each cell, so a constant gene still shifts that cell's mean and SD and therefore every standardized value.- The filter ran on the wrong genes.
FilterAnchorsusesTopDimFeatures— at most 200 genes picked from the CCA loadings (193 here), not the full 2,000-gene anchor set. - The filter ran on the wrong layer. Seurat's
slot = "data", the log-normalized values; truecell usedscale.data. - The score used one pooled kNN.
ScoreAnchorsgives each anchor memberk.scoreneighbours within its own dataset plusk.scorein the other — 2·k.score cells from four separate searches. With a batch effect present a pooled neighbourhood is nearly all same-batch, so the two members share almost nothing and every score collapses toward the floor. k.filtershrank instead of standing down. Seurat keeps every anchor whenmin(len(cells1), len(cells2)) < k.filter. Clamping k to the query size quietly applies a stricter filter than asked for, on the datasets least able to afford it.- Filtering and scoring were the wrong way round.
FindAnchorsfilters then scores, and the score is rescaled against the 1st/90th percentiles of whatever set it is handed. Scoring first takes those percentiles from anchors that are about to be discarded: same ranking, every value shifted. This one surfaced only during the port — mean score 0.5477 against Seurat's 0.4971, with just 10.5 % identical. _pca_loadingsused sklearn's randomized SVD. For a matrix this shape sklearn switches to a randomized solver, which is accurate in the leading components and drifts in the trailing ones — only 12–14 of 30 PCs matched irlba above 0.99. Ordinarily that is harmless. Reciprocal PCA standardizes each projected dimension by its own SD, and that is not rotation invariant, so a drifted trailing axis becomes a different reciprocal space and a different anchor. Exact SVD matches irlba to 1.0000 on all 30 PCs and takes RPCA recall from 44.9 % to 100 %.
integrate_data
- The weights were computed in the wrong space.
RunIntegrationmerges the pair, re-runsScaleDataon the anchor features and runs a fresh PCA, then searches there. truecell reused the CCA embedding — a space built to make the batches overlap, which is not the same neighbourhood. - The kernel (above).
k_weightcounts anchors, not anchor cells.FindWeightsCwalks the nearest anchor cells outward, expands each into all of its anchor rows and stops atk_weightentries. At ~2.7 anchors per cell only the nearest ~37 cells contribute, not 100. The neighbour search also runs over the unique query anchor cells: a cell anchoring five times is one candidate.integrate_layerscorrected the wrong direction. Seurat'sPairwiseIntegrateReferencereverses the merge pair whenever the second object is bigger, so the reference is the larger batch. truecell took the first. Invisible on an even split; ifnb is CTRL 6,548 vs STIM 7,451.
What this did to the integration tutorial
Full ifnb, through integrate_layers, against Seurat's v5 IntegrateLayers:
| before | after | Seurat | |
|---|---|---|---|
| CCA — cell-type recovery | 0.884 | 0.918 | 0.927 |
| CCA — batch mixing | 0.990 | 0.991 | 0.991 |
| RPCA — cell-type recovery | 0.677 | 0.922 | 0.736 |
| RPCA — batch mixing | 0.867 | 0.991 | 0.917 |
Reference mapping (panc8, which shares these helpers) improved without being
targeted: accuracy 0.9845 → 0.9862, label concordance 0.9871 → 0.9883.
RPCA's numbers moved twice more after this table was first written — see
the v5 IntegrateLayers section
below, which is where the "still open" gap noted at the bottom of this page
turned out to live.
A number that got worse before it got better
Fixing the weight kernel dropped RPCA's batch-mixing score from 0.867 to 0.689 — worse than the code it replaced.
That was the correct kernel exposing a defect it had been masking. The old Gaussian was broad and undiscriminating, so it smeared the batches together regardless of whether the anchors were any good — and batch-mixing entropy rewards exactly that. Underneath, RPCA was recovering 44.9 % of Seurat's anchors. With the kernel honest, the bad anchors had nowhere to hide.
The temptation to restore the old kernel and keep 0.867 is the thing to resist: it would have meant reinstating a bug to flatter a metric. Chasing the anchors instead led to defect 8, and RPCA now agrees with Seurat on every single one.
A metric that improves when you break something is measuring the wrong thing.
This is the second time in this port — the sketching cycle had a broken
project_data that scored better than its fix.
Two dead ends worth recording
A candidate R-side defect that wasn't. Probing FindWeightsC synthetically,
whole anchor rows came back zero — which looked like an off-by-one in the
compiled code. On a real run the 29 zero rows are exactly the 29 score-0
anchors. The probe had been calling the function outside the domain its only
caller uses.
A fix that fixed nothing. Seurat runs each object's PCA on that object's own non-constant features (1,966 / 1,951) and projects across on their 1,917-feature intersection. Reproducing that exactly left the anchor set byte-identical, so it was reverted rather than shipped as unverifiable complexity. The cause was the SVD solver, one layer down.
v5 IntegrateLayers runs a different algorithm than v4 IntegrateData
Everything above is the v4 path: FindIntegrationAnchors + IntegrateData,
called directly on a list of objects. Seurat also ships a v5 dispatch API,
IntegrateLayers(method = CCAIntegration), and truecell's integrate_layers
wraps it. They are not the same algorithm wearing a different name.
Reading RPCAIntegration's source rather than assuming it delegates to
IntegrateData turned up the actual call chain: it finds anchors the same
way, then hands them to IntegrateEmbeddings, which transposes the input
PCA embedding into a fake assay whose "features" are the 30 dimensions and
runs the same anchor-weighting machinery over that — correcting the
embedding directly. IntegrateData corrects expression and leaves you to
ScaleData + RunPCA again, landing in a new basis. truecell's integrate_layers
was doing the latter behind the v5 name: a different object with the same
shape, agreeing with Seurat's actual output on only 1 of 30 dimensions
above |r| = 0.99.
Alongside it, a second defect that had been hiding in the "expected
implementation gap": run_pca's _pca_loadings helper already needed an
exact SVD for reciprocal PCA's own trailing-PC sensitivity (defect 8, above);
the public run_pca still used sklearn's randomized solver, which drifts
the same way once max(shape) > 500 — only 15 of 30 PCs matched Seurat's
irlba above |r| = 0.99, one down at 0.006. Invisible when only the leading
PCs are read downstream; not invisible when IntegrateEmbeddings corrects the
embedding itself. Fixed with the same ARPACK solver _pca_loadings uses —
deterministic, and six times faster than a dense SVD on data this shape.
| before | after | |
|---|---|---|
| RPCA embedding, dims |r| > 0.99 (2,400-cell probe) | 1/30 | 30/30 |
| CCA embedding, dims |r| > 0.99 (2,400-cell probe) | 1/30 | 30/30 |
| RPCA embedding, dims |r| > 0.99 (full 13,999-cell, unequal batches) | — | 30/30 |
| RPCA batch mixing (full ifnb) | 0.867 | 0.991 (Seurat: 0.917) |
| RPCA cell-type recovery (full ifnb) | 0.677 | 0.922 (Seurat: 0.736) |
Both clustering rows were measured while find_clusters ran igraph's single
Louvain pass. With Seurat's own optimiser they read 0.9165 and 0.7300, beside
Seurat's 0.9171 and 0.7364.
Reference-half cells — the ones IntegrateEmbeddings copies through
untouched — now match Seurat at exactly zero difference, not just close;
that is the sharpest single check available, since any route that recomputes
rather than copies will show noise there.
What was left was not integration, it was clustering. RPCA's partition
agreement with R (ARI(py,R)) stayed at 0.774 with the embedding matching to
30/30 dims, and clustering Seurat's own RPCA embedding through truecell gave
truecell's numbers, not Seurat's. find_clusters now runs Seurat's optimiser,
and ARI(py,R) is 0.942: see
the clustering section of the integration vignette.
Reproducing
Rscript tutorials/export_seuratdata.R ifnb     # one-time counts export
python  tutorials/anchors_tutorial.py          # writes the cell list + HVGs
Rscript tutorials/anchors_verify.R             # writes the Seurat anchors
python  tutorials/anchors_tutorial.py --report
python  tutorials/generate_anchors_plots.py
The v5 section above is exercised by the integration tutorial
(tutorials/ifnb_integration_tutorial.py, tutorials/ifnb_integration_verify.R)
rather than by anchors_tutorial.py, which only calls the v4 API.
The Python side writes the subsample and the anchor features; R reads both, so the two tools integrate the same cells on the same basis and the only differences left are the algorithms.
nn.method = "rann" gives Seurat exact neighbours. Its default is annoy, which
is approximate — re-running identical data with annoy moves about 0.3 % of the
anchors, and that noise would be indistinguishable from a real disagreement.
What is still open
The 14 fixes across both rounds are pinned by tests/test_anchors_seurat_parity.py
and tests/test_pca_solver_parity.py, and each was mutation-tested: break
the fix, confirm a named test fails. Four guards were decorative on the first
pass and had to be rebuilt — the fixtures were not in the regime where the
defect exists (a 120-cell batch never trips k_filter=200; a 300×220 matrix
never trips sklearn's randomized solver, which needs max(shape) > 500; the
stdev formula guard needed un-centred scale.data, because the two
candidate formulas agree exactly once every gene's mean is zero).
Not addressed here:
- The guide tree. truecell integrates reference-to-query; Seurat builds a
BuildSampleTreemerge order for three or more datasets. Two-dataset integration is unaffected.
Seurat's modularity search was on this list until the Frontiers revision. The
graphs agreed, and the difference was that Seurat runs 10 restarts of its own
optimiser where truecell ran one igraph pass. truecell's shallower optimum
scored better against ifnb's annotations, so the search was left alone. It has
since been ported, which closed ARI(py,R): see
the integration vignette.